PPT-1 Supplemental Figure S1
SO
susan2
Published 2021-01-28 | 4974 Views
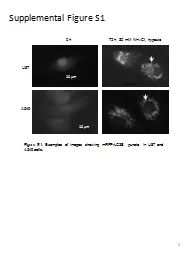
Figure S1 Examples of images showing mRFPLC3B puncta in U87 and A549 cells U87 72 h 30 mM NH 4 Cl hypoxia 0 h A549 20 μ m 20 μ m Supplemental Figure S2 A B Figure
Download Presentation
Download Presentation The PPT/PDF document "1 Supplemental Figure S1" is the property of its rightful owner. Permission is granted to download and print the materials on this website for personal, non-commercial use only, and to display it on your personal computer provided you do not modify the materials and that you retain all copyright notices contained in the materials. By downloading content from our website, you accept the terms of this agreement.