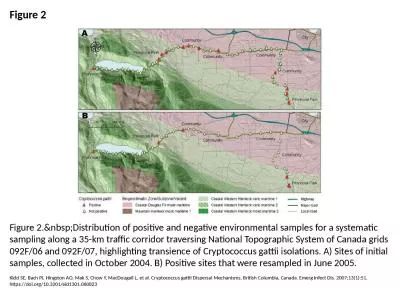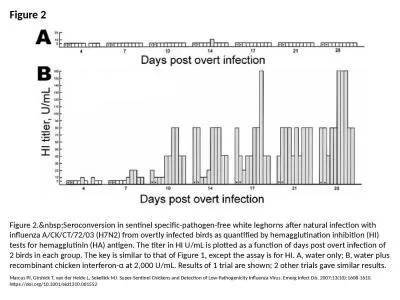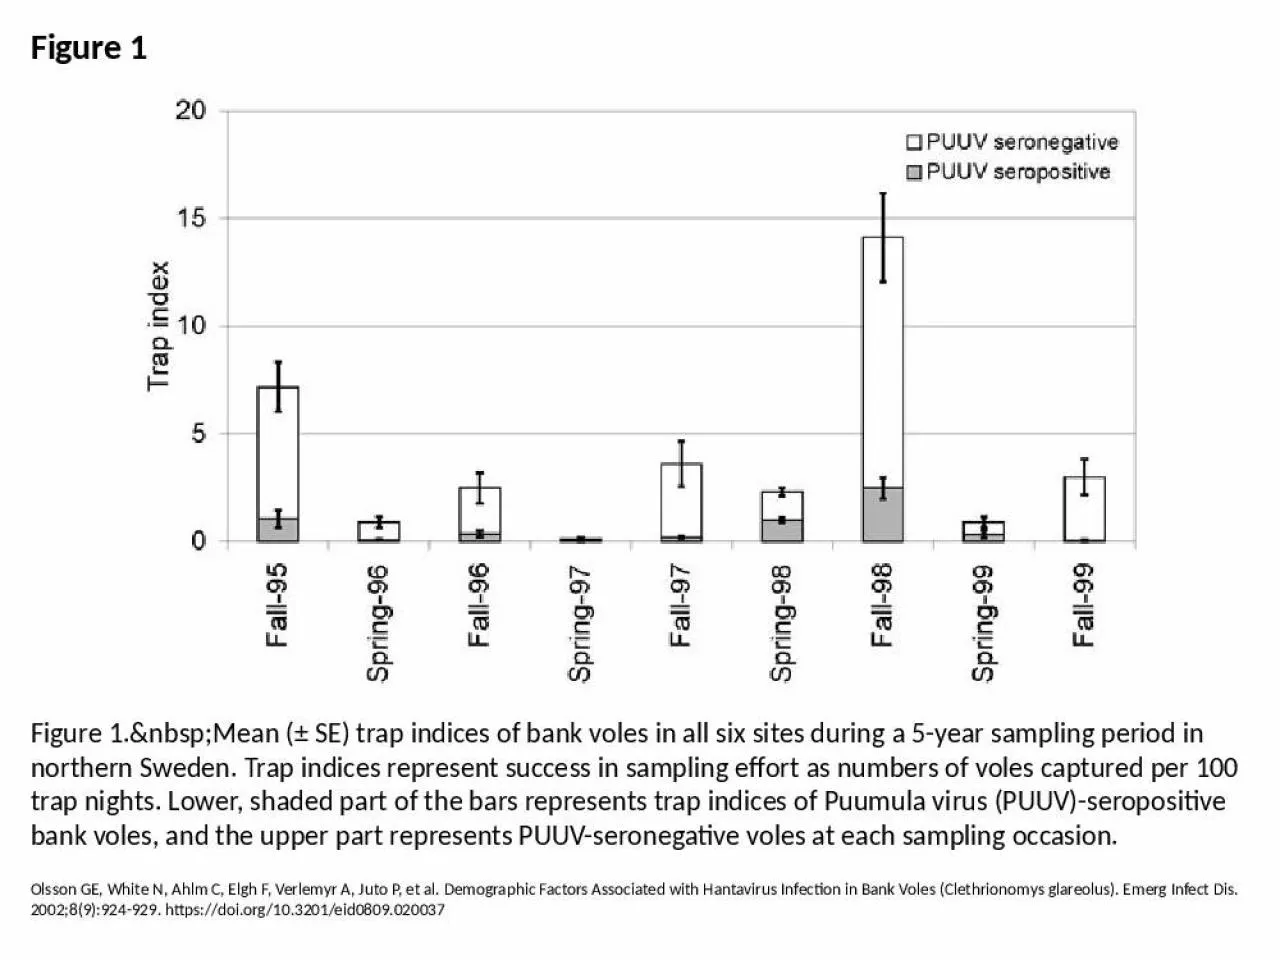
PPT-Figure 1 Figure 1. Mean (± SE) trap indices of bank voles in all six sites during
Author : heavin | Published Date : 2024-07-02
Olsson GE White N Ahlm C Elgh F Verlemyr A Juto P et al Demographic Factors Associated with Hantavirus Infection in Bank Voles Clethrionomys glareolus Emerg Infect
Presentation Embed Code
Download Presentation
Download Presentation The PPT/PDF document "Figure 1 Figure 1. Mean (± SE)..." is the property of its rightful owner. Permission is granted to download and print the materials on this website for personal, non-commercial use only, and to display it on your personal computer provided you do not modify the materials and that you retain all copyright notices contained in the materials. By downloading content from our website, you accept the terms of this agreement.
Figure 1 Figure 1. Mean (± SE) trap indices of bank voles in all six sites during: Transcript
Download Document
Here is the link to download the presentation.
"Figure 1 Figure 1. Mean (± SE) trap indices of bank voles in all six sites during"The content belongs to its owner. You may download and print it for personal use, without modification, and keep all copyright notices. By downloading, you agree to these terms.
Related Documents