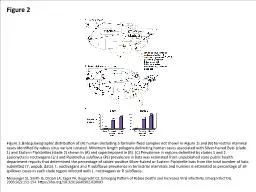
PPT-Figure 2 Figure 2. Distribution of positive and negative environmental samples
Author : anderson | Published Date : 2023-07-12
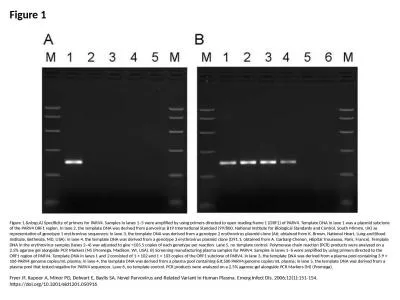
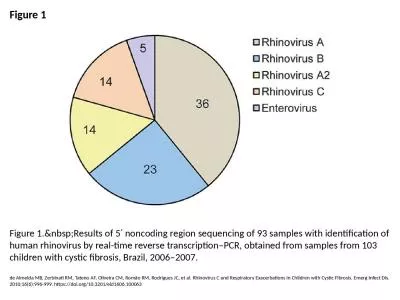
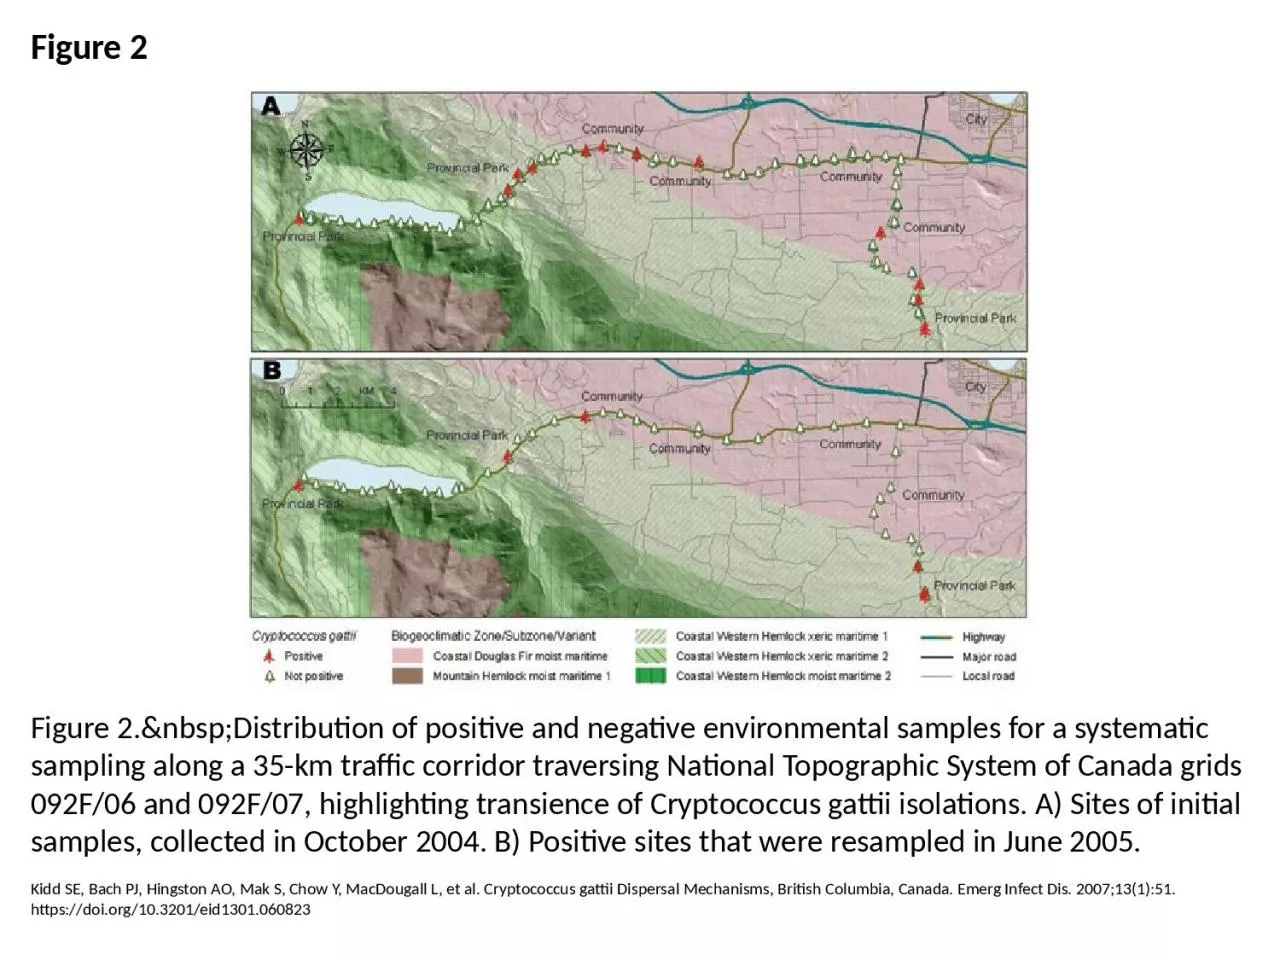
Kidd SE Bach PJ Hingston AO Mak S Chow Y MacDougall L et al Cryptococcus gattii Dispersal Mechanisms British Columbia Canada Emerg Infect Dis 200713151 httpsdoiorg103201eid1301060823
Presentation Embed Code
Download Presentation
Download Presentation The PPT/PDF document "Figure 2 Figure 2. Distribution..." is the property of its rightful owner. Permission is granted to download and print the materials on this website for personal, non-commercial use only, and to display it on your personal computer provided you do not modify the materials and that you retain all copyright notices contained in the materials. By downloading content from our website, you accept the terms of this agreement.
Figure 2 Figure 2. Distribution of positive and negative environmental samples: Transcript
Download Document
Here is the link to download the presentation.
"Figure 2 Figure 2. Distribution of positive and negative environmental samples"The content belongs to its owner. You may download and print it for personal use, without modification, and keep all copyright notices. By downloading, you agree to these terms.
Related Documents