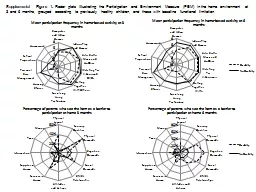
Supplemental Figure 1:
Radar plots illustrating the Participation and Environment Measure PEM in the home environment at 3 and 6 months grouped according to previously healthy children and those with baseline functional
Embed this Presentation
Available Downloads
Download Notice
Download Presentation The PPT/PDF document "Supplemental Figure 1:" is the property of its rightful owner. Permission is granted to download and print the materials on this website for personal, non-commercial use only, and to display it on your personal computer provided you do not modify the materials and that you retain all copyright notices contained in the materials. By downloading content from our website, you accept the terms of this agreement.