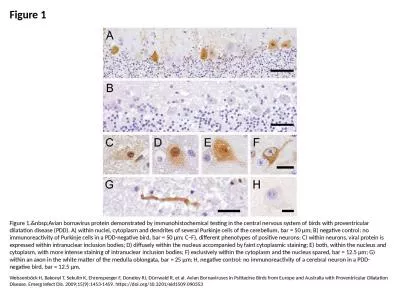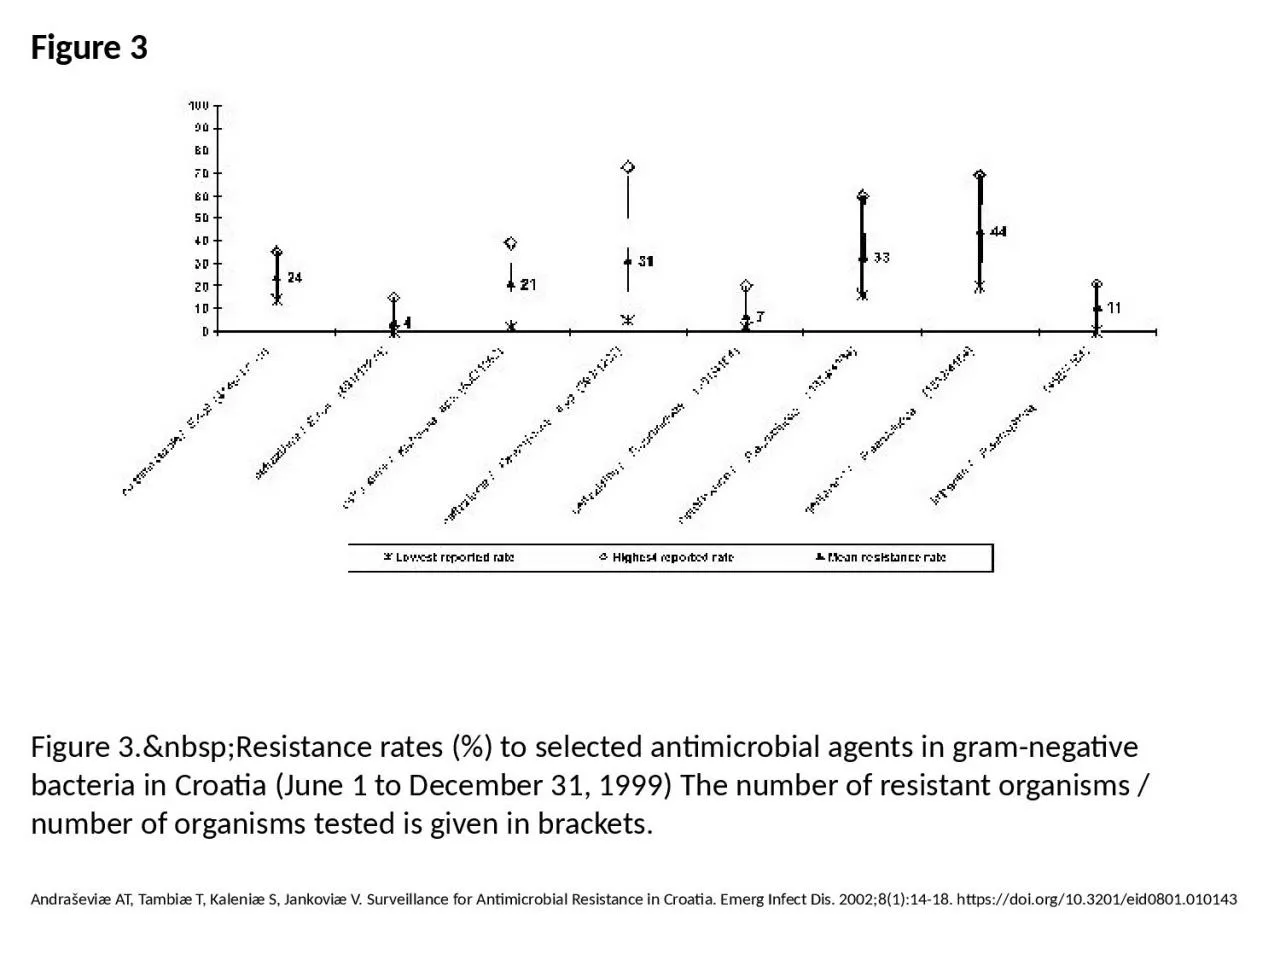
PPT-Figure 3 Figure 3. Resistance rates (%) to selected antimicrobial agents in gram-negative
Author : dora | Published Date : 2024-01-03
Andraševiæ AT Tambiæ T Kaleniæ S Jankoviæ V Surveillance for Antimicrobial Resistance in Croatia Emerg Infect Dis 2002811418 httpsdoiorg103201eid0801010143
Presentation Embed Code
Download Presentation
Download Presentation The PPT/PDF document "Figure 3 Figure 3. Resistance r..." is the property of its rightful owner. Permission is granted to download and print the materials on this website for personal, non-commercial use only, and to display it on your personal computer provided you do not modify the materials and that you retain all copyright notices contained in the materials. By downloading content from our website, you accept the terms of this agreement.
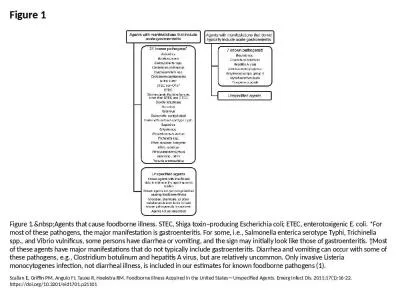
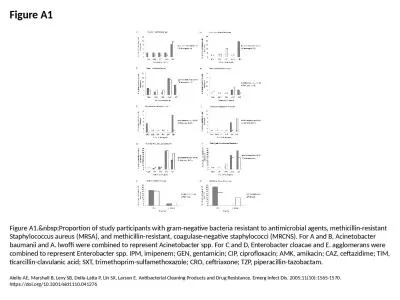
Figure 3 Figure 3. Resistance rates (%) to selected antimicrobial agents in gram-negative: Transcript
Download Document
Here is the link to download the presentation.
"Figure 3 Figure 3. Resistance rates (%) to selected antimicrobial agents in gram-negative"The content belongs to its owner. You may download and print it for personal use, without modification, and keep all copyright notices. By downloading, you agree to these terms.
Related Documents