/
The Opportunities and Challenges for Rural Hospitals in an Era of The Opportunities and Challenges for Rural Hospitals in an Era of

The Opportunities and Challenges for Rural Hospitals in an Era of - PowerPoint Presentation

taylor
taylor . @taylor
Follow
2 views
Uploaded On 2024-07-04

The Opportunities and Challenges for Rural Hospitals in an Era of - PPT Presentation

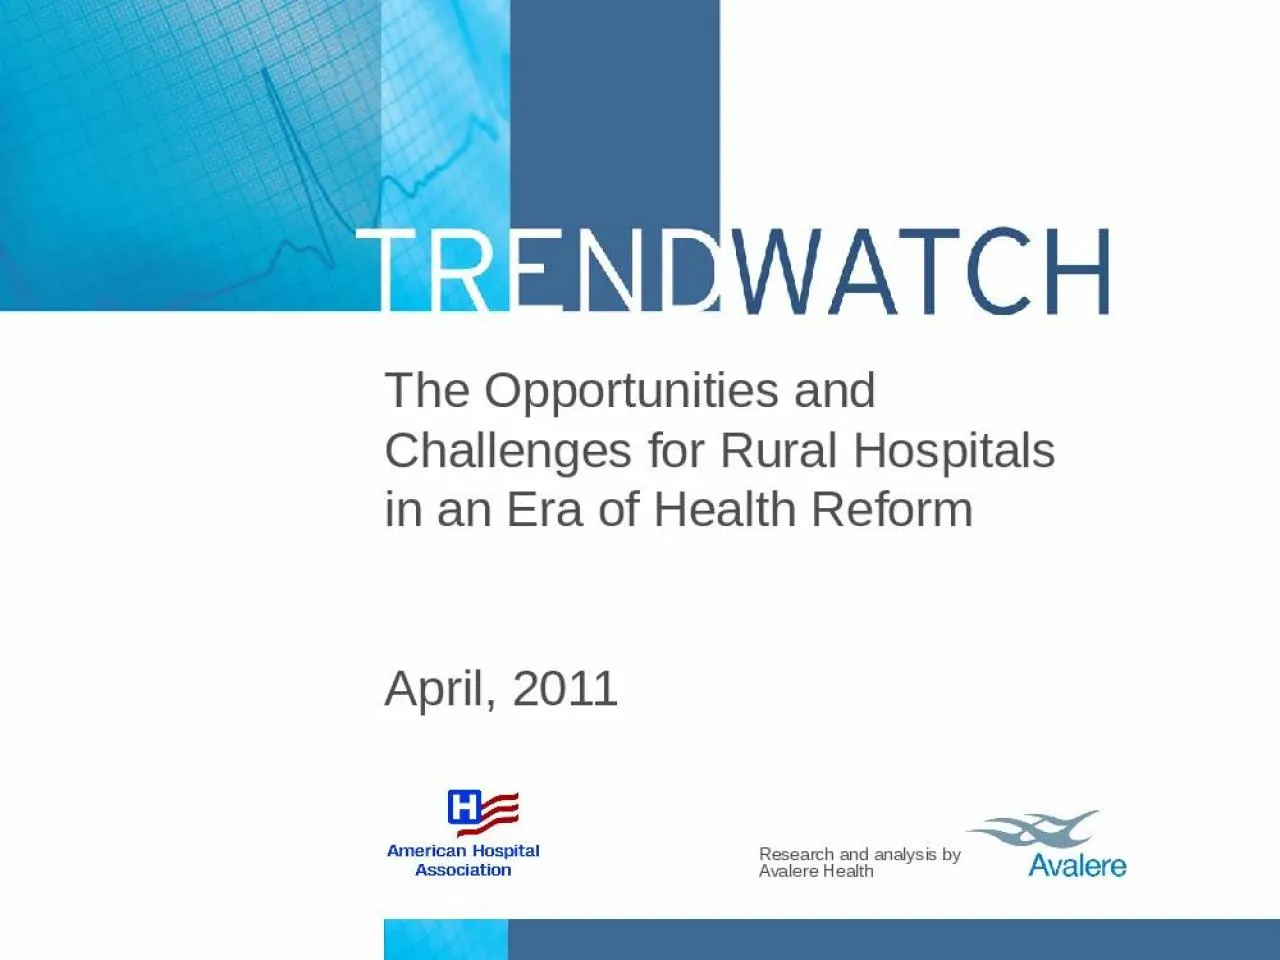
Health Reform April 2011 Rural populations are older and poorer than urban populations Chart 1 Percent of Population over Age 65 2009 Source US Census Bureau American Community ID: 1053314

rural hospitals chart health hospitals rural health chart hospital 2009 percent medicaid survey medicare urban access population aha analysis

Share:

Link:

Embed:


Presentation Transcript

1. The Opportunities and Challenges for Rural Hospitals in an Era of Health ReformApril, 2011

2. Rural populations are older and poorer than urban populations. Chart 1: Percent of Population over Age 65, 2009Source: U.S. Census Bureau. American Community Survey Estimates and Current Population Survey Annual Social and Economic Supplement (CPS ASEC), 2009. Access at http://www.census.gov/cps/.* Poverty defined as <100% FPL.Note: MSA is metropolitan statistical area. Chart 2: Percent of Population in Poverty,* 2009In MSANot in MSA

3. Source: Centers for Disease Control and Prevention. (2009). Summary Health Statistics for U.S. Adults: National Health Interview Survey, 2009. Access at http://www.cdc.gov/nchs/data/series/sr_10/sr10_249.pdf.Note: MSA is metropolitan statistical area. Large MSAs have a population of 1 million or more; small MSAs have a population of less than 1 million.Chart 3: Age-adjusted Percentage of Individuals with Select Chronic Conditions, 2009Chronic diseases are more common in rural areas.

4. Chart 4: Percent of Hospitals by Bed Size, Urban vs. Rural, 2009 Source: AHA analysis of Health Forum, 2009. AHA Annual Survey of Hospitals.Note: Includes only beds in hospital units.Rural hospitals tend to be smaller than their urban counterparts.

5. Chart 5: Outpatient as a Percent of Total Gross Revenue, Urban vs. Rural Hospitals, 1990 - 2009Source: AHA analysis of Health Forum, 2009. AHA Annual Survey of Hospitals.Rural hospitals have seen a more dramatic shift of care to the outpatient setting…

6. Chart 6: Percentage of Hospitals Offering “Non-hospital” Services, by Location, 2009Source: Avalere Health analysis of Health Forum, 2009. AHA Annual Survey of Hospitals.Based on 4,086 community hospitals responding to these questions....and are more likely to offer home health, skilled nursing and assisted living.

7. Chart 7: Medicare Margins by Service for Rural Hospitals, 2009Source: Vaida Health Data Consultants analysis of Centers for Medicare and Medicaid Services, HCRIS Database, September 30, 2010 Update. Uses Medicare cost accounting rules to determine allowable costs. Full assignment of costs using generally accepted accounting principles would result in lower margins. Medicare payment shortfalls are even greater for outpatient, home health and skilled nursing.

8. Chart 8: Percent of Gross Revenue by Payer Type for Rural Hospitals, 2009Source: Avalere Health analysis of American Hospital Association Annual Survey data, 2009.Nearly sixty percent of rural hospital revenues come from public programs…

9. …whose payments fall short of costs.Source: AHA analysis of American Hospital Association Annual Survey data, 1997-2009, for community hospitals. *Costs reflect a cap of 1.0 on the cost-to-charge ratio.Chart 9: Aggregate Hospital Payment-to-cost Ratios for Medicare and Medicaid, 1997 – 2009MedicareMedicaid

10. Sources: CMS final FY2011 Inpatient PPS Payment Impact file (for all designations except CAH). All figures exclude any urban hospitals that may have these classifications; American Hospital Association. (2002). Challenges Facing Rural Hospitals. Washington, DC.Note: DSH is Disproportionate Share Hospital.* Includes Sole Community Hospital/Rural Referral Centers (SCH/RRC).** Includes Medicare-Dependent Hospital/Rural Referral Centers (MDH/RRC).Chart 10: Medicare Programs for Rural Hospitals and Number of Hospitals, by Program TypeSpecial programs aim to help rural hospitals.Sole Community Hospital (SCH)N= 395*Geographically isolated hospitals are paid the greater of the current PPS rate or a base year cost per discharge updated to the current year and may receive higher DSH paymentsMedicare-Dependent Hospital (MDH)N=195**Hospitals with fewer than 100 beds and Medicare loads over 60% receive greater of PPS rate or updated base year costsCritical Access Hospital (CAH)N=1325Geographically isolated hospitals with no more than 25 inpatient beds that provide 24-hour emergency care receive cost-based reimbursement for inpatient and outpatient servicesRural Referral Center (RRC)N=125Large rural specialty facilities with 275 or more beds may receive higher DSH payments

11. Critical access hospitals serve patients in the vast majority of states. Chart 11: Location of Critical Access Hospitals Nationwide, 2009Source: Department of Health and Human Services (2009). Critical Access Hospitals. Rural Assistance Center. Baltimore, MD: Centers for Medicare & Medicaid Services. Access at http://www.raconline.org/maps/#map_cah.

12. Chart 12: Percent of Hospitals Reporting They Can Meet Each Meaningful Use Core Objective and Have Certified EHR Technology Rural hospitals are making progress in meeting meaningful use objectives but lag urban providers for many functions.Source: AHA analysis of survey data from 1,297 non-federal, short-term acute care hospitals collected in January 2011.

13. New eligibility rules will increase Medicaid enrollment by more than 30 percent in many rural states.Source: Holahan, J., and Headen, I. (2010). Medicaid Coverage and Spending in Health Reform: National and State-by-State Results for Adults at or below 133% FPL. Kaiser Commission on Medicaid and the Uninsured. Access at http://www.kff.org/healthreform/8076.cfm.Note: The estimates assume a 57% participation rate. The estimates include newly enrolled 1115 waiver eligible population. The estimates do not take into account the effects of states shifting individuals with incomes >133% FPL from Medicaid to the exchange, the effects of reform for children, or changes in Medicaid between 2010 and 2014. 30.1% to 40%20.1% to 30%≤ 20% ≥ 40.1%Chart 13: Percent Increase in Medicaid Enrollment Under the ACA, 2019Percent Change from 2019 Baseline Medicaid Enrollment

14. Source: U.S. Department of Agriculture. (2009). Amber Waves. Washington, DC: USDA Economic Research Service.Calculations based on the 2004 data from the Area Resource File, National Center for Health Statistics.Note: Among nonmetro counties, micropolitan counties are centered on urban clusters with populations between 10,000 and 50,000, and noncore counties have no nearby urban clusters with a population of 10,000 or more.Chart 14: Percent of Households in Health Care Professional Shortage Areas, by Type of ShortageHealth professional shortages are more common in remote areas.Type of Shortage