PPT-Exhibit 1:Summary Table Summary
SO
tatiana-dople
Published 2019-06-22 | 4954 Views
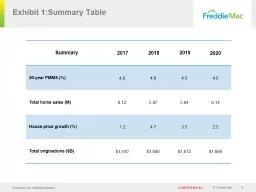
2017 2018 2019 2020 30year PMMS 40 46 45 48 Total home sales M 612 597 594 614 House price growth 72 47 35 25 Total originations B 1810 1646
Download Presentation
Download Presentation The PPT/PDF document "Exhibit 1:Summary Table Summary" is the property of its rightful owner. Permission is granted to download and print the materials on this website for personal, non-commercial use only, and to display it on your personal computer provided you do not modify the materials and that you retain all copyright notices contained in the materials. By downloading content from our website, you accept the terms of this agreement.