Explore
Featured
Recent
Articles
Topics
Login
Upload
Featured
Recent
Articles
Topics
Login
Upload
Search Results for 'run proc'
run proc published presentations and documents on DocSlides.
CS Example: General Linear Test (cs2.sas) proc reg data
by calandra-battersby
CS Example: General Linear Test (cs2.sas) proc ...
PROC CATALOG The Wish Book SAS® Procedure
by olivia-moreira
PROC . CAT. ALOG, the Wish Book SAS® . Procedure...
Kurtosis
by ellena-manuel
SAS. g1g2.sas. ;. data. EDA; . infile. 'C:\User...
Graphics in EG and R
by danika-pritchard
HRP223 – 2009. November, 2010 . Copyright © . ...
Graphics
by conchita-marotz
HRP223 – 2011. November 28, 2011 . Copyright ©...
Graphics – Part 3
by briana-ranney
HRP223 – 2013. December 2, 2013 . Copyright © ...
Scatterplot Smoothing Using PROC LOESS and Restricted Cubic
by jane-oiler
Jonas V. . Bilenas. Barclays Global Retail Bank/U...
SAS Graphics on ODS v9.2 Performance Enhancing Steroids
by yoshiko-marsland
. Daniel O’Connor. Systems Developer, SAS Inst...
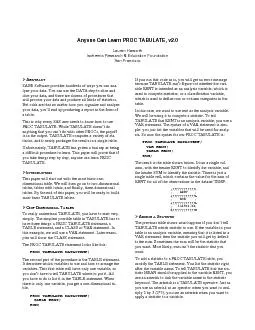
Anyone Can Learn PROC TABULATE, v2.0Lauren HaworthIschemia Research &
by min-jolicoeur
PROC TABULATE DATA=TEMP;VAR RENT;TABLE RENT*MEAN;R...
Graphics
by ellena-manuel
HRP223 – 2013. November 18, 2013 . Copyright ©...
Graphics – Part 2
by danika-pritchard
HRP223 – 2013. November 20, 2013 . Copyright ©...
Data Cleaning 101
by pamella-moone
Ron Cody, Ed.D. Robert Wood Johnson Medical Schoo...
Graphics HRP223 – 2013
by aaron
November 18, 2013 . Copyright © . 1999-2013 . L...
Graphics – Part 3 HRP223 – 2013
by lindy-dunigan
December 2, 2013 . Copyright © . 1999-2013 . Le...
Graphics – Part 2 HRP223 – 2013
by debby-jeon
November 20, 2013 . Copyright © . 1999-2013 . L...
Graphing Logits Graphing Proportion Positive (Rates)
by walsh
data. chd2018_a(. keep. =. chd. age);. . set. ...
ODS Graphics:
by sherrill-nordquist
Modifying Style Attributes. October 21, 2015. Roc...
Is Your Randomization Really Random?
by pamella-moone
By: Arteid Memaj and Carolyn Romano. Agenda. Desc...
Is Your Randomization Really Random?
by giovanna-bartolotta
By: Arteid Memaj and Carolyn Romano. Agenda. Desc...
Data Manipulation in SAS
by oconnor
CTSI BERD Core Seminar. Emily K.Q. Sisson. June 15...
Calibration plots 1 The programs in this topic are adapted from programs
by ida
that appeared in the DO LOOP, SAS Blog. 2. Do a lo...
1 Basic Queries Specifying Columns
by min-jolicoeur
3. Produce a report that contains the employee id...
SAS ®
by karlyn-bohler
Global Forum 2014. March 23-26 . Washington, DC....
Structuring SAS Data Sets and Working with Multiple Observa
by alexa-scheidler
Timothy Forsyth. Ashok . Viswanathan. Debbie McCu...
SEEMINGLY UNRELATED REGRESSION
by jane-oiler
INFERENCE AND TESTING. Sunando. . Barua. Binamra...
Multiple Imputation
by marina-yarberry
Multiple Regression. Input From SPSS. *** . Mult-...
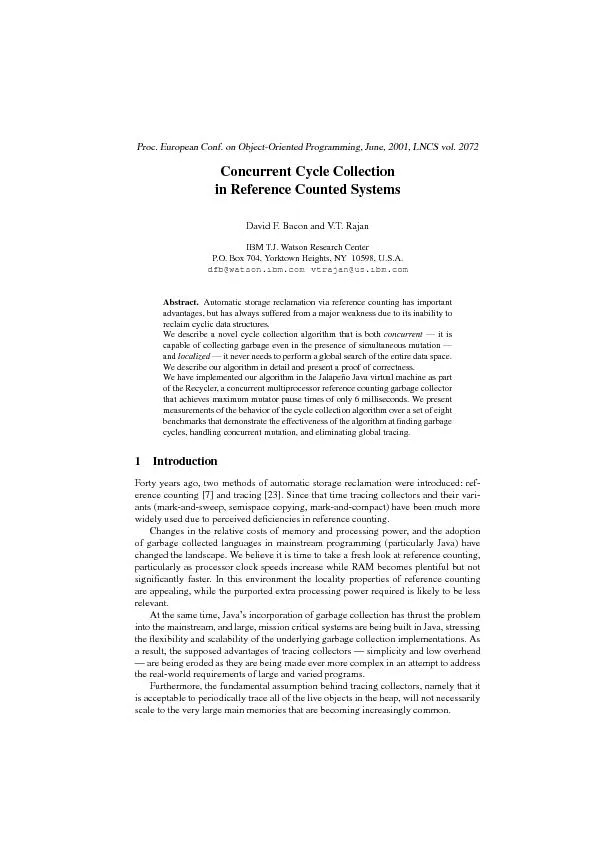
Proc.EuropeanConf.onObject-OrientedProgramming,June,2001,LNCSvol.2072C
by myesha-ticknor
2DavidF.BaconandV.T.RajanTherearethreeprimaryprobl...
Comparing Regression Lines
by tawny-fly
From Independent Samples. The Design. You have tw...
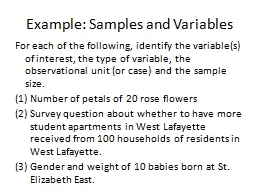
Example: Samples and Variables
by danika-pritchard
For each of the following, identify the variable(...
Moving Average Model Moving average model of order MA where
by conchita-marotz
are constants with 0 is Gaussian white noise wn0...
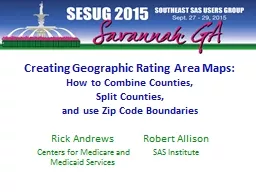
Creating Geographic Rating Area Maps:
by natalia-silvester
How to Combine Counties, . Split . Counties, . &a...
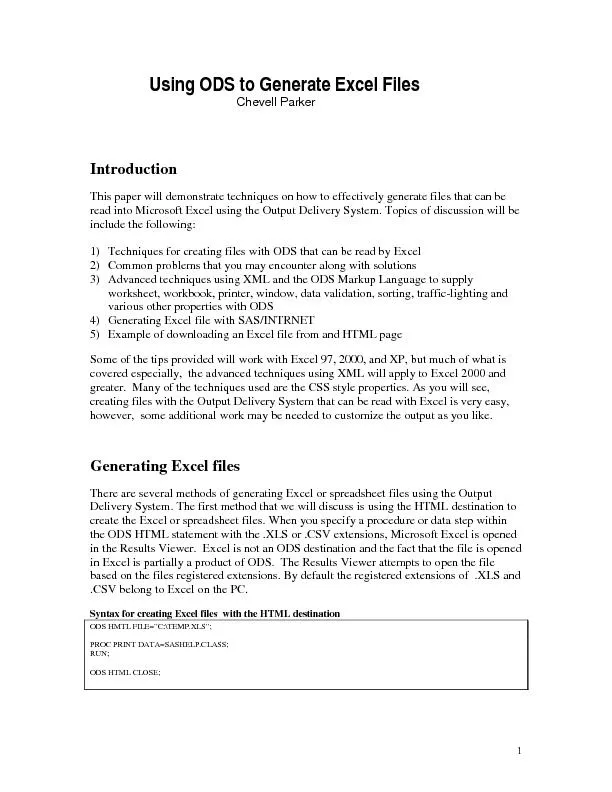
Using ODS to Generate Excel Files
by giovanna-bartolotta
PROC PRINT DATA=SASHELP.CLASS; RUN; ODS HTML CLO...
SAS ®
by lois-ondreau
101. Based on . Learning SAS by Example: . A Pro...
Analyzing and visualizing interactions in
by tawny-fly
sAS. 9.4. Andy Lin. IDRE Statistical Consulting....
Next
by test
Presentation:. Presenter. :. . Arthur . Tabachn...
Creating Geographic Rating Area Maps:
by luanne-stotts
How to Combine Counties, . Split . Counties, . &a...
SAS ® Global Forum 2014
by phoebe-click
March 23-26 . Washington, DC. Got Randomness? . ...
Introduction to Graphing in SAS
by briana-ranney
Greg Grandits, Division of Biostatistics. March 6...
Analyzing and visualizing interactions in
by celsa-spraggs
sAS. 9.4. Andy Lin. IDRE Statistical Consulting....
ANOVA: Graphical Cereal Example: nknw677.sas
by luanne-stotts
Y = number of cases of cereal sold (CASES). X = d...
Load More...