Explore
Featured
Recent
Articles
Topics
Login
Upload
Featured
Recent
Articles
Topics
Login
Upload
Search Results for 'line graph'
line graph published presentations and documents on DocSlides.
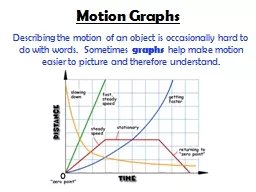
Motion Graphs
by trish-goza
Describing the motion of an object is occasionall...
Graphing A Function Rule
by kittie-lecroy
Lesson 4-4. To graph a function rule:. Choose 3-5...
1.1 FUNCTIONS AND FUNCTION NOTATION
by ellena-manuel
1. What Is a Function?. A . function . is a rule ...
Interpreting the intersection of two linear graphs
by jasmine
(from 4.2 Graphical representations). KS3 Mastery ...
A histogram is a graphical representation of the distribution of data.
by zoe
It is an estimate of the probability distribution ...
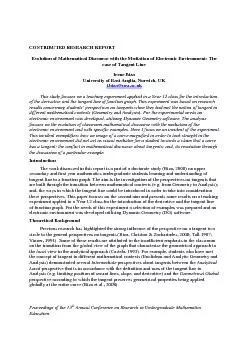
Proceedings of the 13th Annual Conference on Research in Undergraduate
by desha
i.biza@uea.ac.uk This study focuses on a teachin...
Warm-up In 5 Subject notebook, put warmups in the last section, write the date
by marina-yarberry
Warm-up In 5 Subject notebook, put warmups in th...
21 st Century Lessons Statistical Questions and Representation
by pamella-moone
Mrs. Thompson Level 1. 1. 2. Lesson Objective. SW...
Parallel and Perpendicular Lines
by yoshiko-marsland
A.2E Write the equation of a line that contains a...
Graphics Math, Social Studies, & Science
by liane-varnes
Georgia’s 2016 Adult Education Fall Conference....
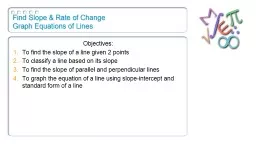
Find Slope & Rate of Change
by yoshiko-marsland
Graph . Equations of Lines. Objectives:. To find ...
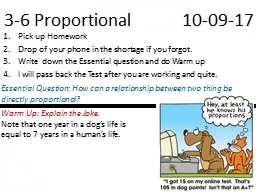
3-6 Proportional 10-09-17
by calandra-battersby
Pick up Homework. Drop of your phone in the short...
Parallel and Perpendicular Lines
by jane-oiler
Geometry. Chapter 3. This Slideshow was developed...
DRAW A LINE OR CURVE
by debby-jeon
ON YOUR GRAPHS. DRAW. A . LINE. OR . CURVE . ON ...
Lesson 91: Linear Inequalities, Greater Than or Equal to, Less than or Equal to, Systems of Linear
by giovanna-bartolotta
A line divides the set of all points in a plane i...
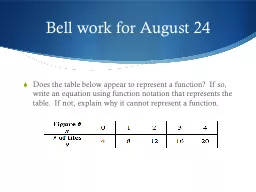
Bell work for August 24
by pamella-moone
Does the table below appear to represent a functi...
Slopes
by trish-goza
Objective: By the end of this unit students will...
Math Refresher Unit II:
by liane-varnes
Graphing, Exponents, and Logs. RPAD Welcome Week ...
Talking
by ellena-manuel
Points. Joseph Ramsey. LiNGAM. Most of the algori...
Tangent Line Problems
by test
Find the equations of tangents at given points. F...
Standard
by calandra-battersby
B. CHOMP. Concept . 5. : Definition of a Function...
Statistics: Using Scatter Plots
by natalia-silvester
Vocabulary. Bivariate. Scatter Plot. Positive Cor...
Motion along a straight line
by liane-varnes
Standard 9. Person outside the bus. The . bus mov...
REPRESENTING LINEAR INEQUALITIES ON GRAPHS
by pasty-toler
You can represent an inequality on a graph.. Ther...
Who Wants to Be a Millionaire
by liane-varnes
2. Chapter 6. Slopes and Lines. $100. $200. $. 40...
Objective
by phoebe-click
The student will be able to:. find the slope of a...
CS 4487/6587
by conchita-marotz
Algorithms for Image Analysis. Correspondence. (s...
Analyzing
by cheryl-pisano
Bivariate. Data . With Fathom. *. CFU 3102.5.10 ...
Graphing Linear Equations
by lindy-dunigan
By: Christine Berg. Edited By: VTHamilton. Linear...
Please
by sherrill-nordquist
CLOSE. . YOUR LAPTOPS,. and turn off and put awa...
Systems of Inequalities
by min-jolicoeur
b. y. Tammy Wallace. Varina High School. What is ...
Math 1241, Spring 2014
by marina-yarberry
Section . 3.3. Rates of Change. Average vs. Insta...
Chapter 4
by min-jolicoeur
Linear and nonlinear relationships. Previously…...
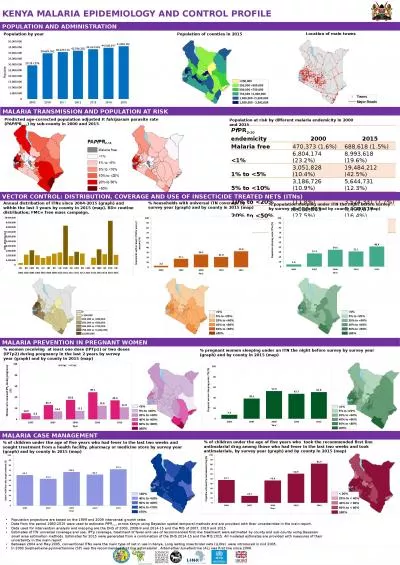
POPULATION AND ADMINISTRATION
by kaiden438
MALARIA TRANSMISSION AND POPULATION AT . RISK. MAL...
Linear Relations and Functions
by ariel
B-1. Relations and Functions. ACT WARM-UP. Emily s...
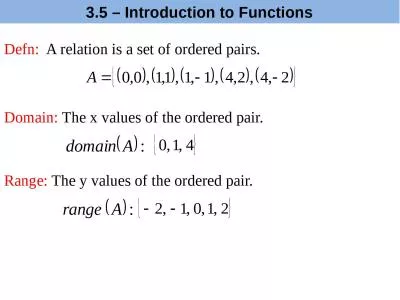
Defn: A relation is a set of ordered pairs.
by bitsy
Domain:. The x values of the ordered pair.. Range...
Bell Ringer # Find the slope:
by kimberly
1. . 2. . 3. . 4. . . 7-5 equations and slope. S...
Year 8 Geog Readings
by teresa
For . Starter Sheets. Year 8 . Geog. Skills No. ...
Intro. to Data Visualization
by jocelyn
S. imple Graphs in Python. using. matplotlib. and...
CHAPTER 5 How to PLOT? Minimum
by sadie
Required: . 5-1-1 to 5-1-3. 5-2. 5-3-2 to 5-3-6. 5...
Load More...