Explore
Featured
Recent
Articles
Topics
Login
Upload
Featured
Recent
Articles
Topics
Login
Upload
Search Results for ''
published presentations and documents on DocSlides.
Quantitative Univariate EDA
by lindy-dunigan
Slide #. 1. Univariate EDA. Purpose – describe ...
Quantitative Univariate EDA
by sherrill-nordquist
Slide #. 1. Univariate EDA. Purpose – describe ...
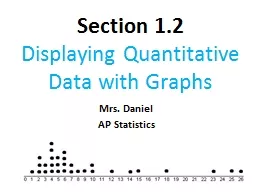
1.2: Displaying Quantitative Data with Graphs
by danika-pritchard
Section 1.2. Displaying Quantitative Data with Gr...
Chapter 4: Displaying Quantitative Data
by stefany-barnette
Histograms. Bins. – equal width “piles” th...
Chapter 3: Displaying and Summarizing Quantitative Data
by tawny-fly
Part 1 . Pg. 43-53. When dealing with a large da...
The Practice of Statistics, 4
by test
th. edition - For AP*. STARNES, YATES, MOORE. Ch...
D isplay Categorical Variables appropriately
by faustina-dinatale
Find and interpret marginal and conditional distr...
Visualizing your data effectively
by min-jolicoeur
Kim Unger – Fall 2017. About me. Senior Analyti...
Quantitative and Psychometric Methods PSY 302
by celsa-spraggs
William P. Wattles, Ph.D.. Spring 2017. 2. My goa...
Chapter 4:
by faustina-dinatale
Displaying & Summarizing Quantitative Data. A...
Welcome to AP Statistics
by alida-meadow
Unit 1 – Day 1 Preliminaries. Introductions/ ro...
Applied Quantitative Methods
by marina-yarberry
MBA course Montenegro. Peter Balogh. PhD. baloghp...
QUANTITATIVE DATA chapter 4
by luanne-stotts
(NUMERICAL). Dotplots. Dot plots work well for . ...
1.2: Displaying Quantitative Data with Graphs
by min-jolicoeur
Section 1.2. Displaying Quantitative Data with Gr...
Analyzing One-Variable Data
by caitlin
Lesson 1.6. Measuring Center. 1. Find and interpre...
Scales of Measurement Nominal
by dandy
classification. labels. mutually exclusive. ...
Data Summarization Data summarization is either by;
by roy
1-. Measurements of central tendency. . (average ...
ECN 3 Diesel Combustion Topic 2:
by joy
Mixing/chemistry interaction. INTRODUCTION. José ...
Highline Class, BI 348
by pasty-toler
Highline Class, BI 348 Basic Business Analytics u...
Week 2 Lecture 1 Chapter 3. Displaying and Summarizing Quantitative Data
by tatiana-dople
1. Graphical displays of a Quantitative data. 2. ...
Modelling in Ecology
by danika-pritchard
Predictions in ecology rely on models. . What is ...
Section 1.1A
by tawny-fly
Introduction; Displaying Distributions with Graph...
- MEASURING THE QUANTITATIVE PARTICLE SIZE DISTRIBUTION OF - SEPARAT
by tatiana-dople
2 With FRITSCH, you have chosen an internationally...
What affects their distribution and how can we investigate
by trish-goza
Organisms and their environment. B2.4. In groups ...
Statistics and Quantitative Analysis
by test
Chemistry 321, Summer 2014. Statistics. is the f...
Quantitative Analysis of Health Equity
by sherrill-nordquist
(on the base of course and w. orkshop. s,. Genewa...
Scales of Measurement
by danika-pritchard
Nominal. classification. labels. mutually e...
Load More...