Explore
Featured
Recent
Articles
Topics
Login
Upload
Featured
Recent
Articles
Topics
Login
Upload
Search Results for 'displaying data'
displaying data published presentations and documents on DocSlides.
Displaying data and interpreting results Displaying d
by myesha-ticknor
96 CI SE 196 Expressed as a range around the per...
Chapter 15: Statistics Section 15.1: Formulating Statistical Questions, Gathering Data, and Using S
by min-jolicoeur
Statistical Questions. Statistical Questions. : o...
Displaying Data &
by lois-ondreau
Result . Interpretation . Dr. . Nawaporn. . Wisi...
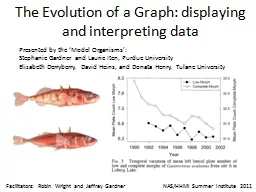
The Evolution of a Graph: displaying and interpreting data
by pasty-toler
NAS/HHMI Summer Institute 2011. Presented by the ...
Chapter 3: Displaying and Summarizing Quantitative Data
by tawny-fly
Part 1 . Pg. 43-53. When dealing with a large da...
Organizing & Displaying Data
by briana-ranney
TEKS and S.E.s. B.2E Analyze data to formulate re...
Chapter 4 Displaying & Summarizing Quantitative Data
by alexa-scheidler
Histograms. Similar to bar charts, but with quant...
Week 2 Lecture 1 Chapter 3. Displaying and Summarizing Quantitative Data
by tatiana-dople
1. Graphical displays of a Quantitative data. 2. ...
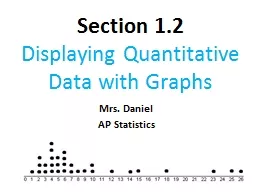
1.2: Displaying Quantitative Data with Graphs
by min-jolicoeur
Section 1.2. Displaying Quantitative Data with Gr...
Chapter 4: Displaying Quantitative Data
by stefany-barnette
Histograms. Bins. – equal width “piles” th...
1.2: Displaying Quantitative Data with Graphs
by danika-pritchard
Section 1.2. Displaying Quantitative Data with Gr...
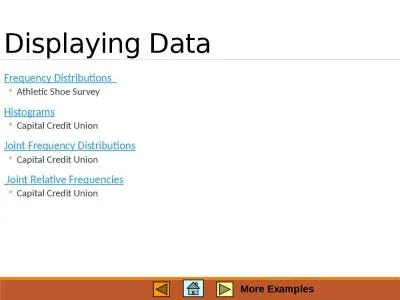
Displaying Data Frequency
by quinn
Distributions. . . Athletic Shoe Survey. Histogr...
Displaying and Integrating Genetic Information Through the EHR
by fauna
Action Collaborative . DIGITizE. AC. Can We Deplo...
Lesson 3 GIS Fundamentals
by lois-ondreau
MEASURE Evaluation. PHFI Training of Trainers. Ma...
Demonstrating Improvements
by trish-goza
Control . Kaizen . Facilitation. Objectives. Unde...
Displaying Data
by cheryl-pisano
Cal State Northridge. 320. Andrew Ainsworth Ph...
Introduction to GrADS Eleventh
by brianna
International Training Workshop Climate Variabilit...
Chapter 3: Displaying and Describing Categorical Data
by sherrill-nordquist
Think, Show, Tell. THINK. . first. Know where y...
GRAPHICALLY DISPLAYING TEXTStephen G. EickAT&T Bell Laboratories - Roo
by yoshiko-marsland
2of data consists of
Problem Statement Discussion
by cheryl-pisano
Electromania. . Tachometer. Ever thought how a s...
Displaying Data
by jane-oiler
from Multiple Tables. Objectives. After completin...
Load More...