Explore
Featured
Recent
Articles
Topics
Login
Upload
Featured
Recent
Articles
Topics
Login
Upload
Search Results for 'data distribution'
data distribution published presentations and documents on DocSlides.
Distribution Statement A: Approved for Public Release, Distribution Unlimited
by tatiana-dople
Hallmark Tools, Capabilities and Evaluation Metho...
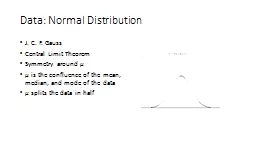
Data: Normal Distribution
by faustina-dinatale
J. C. F. Gauss. Central Limit Theorem. Symmetry a...
APEC Distribution Transformers Survey S EWG 15 12A Progress Update
by remy
– Progress Update. Pierre Cazelles. Director –...
von Mises Distribution Package
by gelbero
Presented by: Vedant Mehta. Kanchan . satpu...
SIVOPyD or SSSOPyD or spdA Python Distribution forScientific Data Anal
by bency
Background (1)Python is used in industry and acade...
How Tall Are you? 2.1A Describing Location in a Distribution
by tawny-fly
Using percentiles. Making an Ogive. Calculating a...
Distribution System Planning Engagement Group
by alida-meadow
Hosting Capacity. August 18, 2016. Summary of Sta...
Current distribution of
by yoshiko-marsland
parthenium. . weed in Kenya and potential impact...
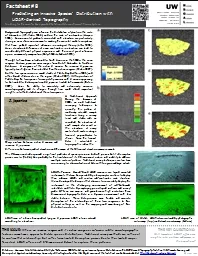
Predicting an Invasive Species’ Distribution with
by celsa-spraggs
LiDAR-derived Topography. Citation: . Hannam, M.,...
Distribution Statement
by min-jolicoeur
A: Approved for Public Release, Distribution Unl...
Current distribution of
by marina-yarberry
parthenium. . weed in Kenya and potential impact...
The Normal Distribution
by jane-oiler
Objectives:. For variables with relatively normal...
1 Chapter 2: The Normal Distribution
by tatiana-dople
2.1 Density Curves and the Normal Distributions....
A Bayesian framework for optimal utilization of plant-pollinator interaction data
by lian
Getting the most out of insect-related data. Backg...
Data Security and Privacy
by piper
k-Anonymity, l-Diversity, t-Closeness, and . Recon...
Analyzing One-Variable Data
by caitlin
Lesson 1.6. Measuring Center. 1. Find and interpre...
1.2: Displaying Quantitative Data with Graphs
by danika-pritchard
Section 1.2. Displaying Quantitative Data with Gr...
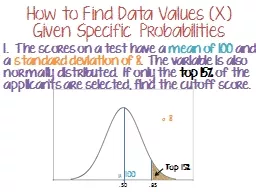
How to Find Data Values (X) Given Specifi
by jane-oiler
c Probabilities. 1. The scores on a test have a ...
Chapter 4: Displaying Quantitative Data
by stefany-barnette
Histograms. Bins. – equal width “piles” th...
1.2: Displaying Quantitative Data with Graphs
by min-jolicoeur
Section 1.2. Displaying Quantitative Data with Gr...
Chapter 1: Exploring Data
by giovanna-bartolotta
Section 1.1. Analyzing Categorical Data. The Prac...
Chapter 3: Displaying and Summarizing Quantitative Data
by tawny-fly
Part 1 . Pg. 43-53. When dealing with a large da...
Displaying Data &
by lois-ondreau
Result . Interpretation . Dr. . Nawaporn. . Wisi...
The Next 700 Benchmarking Frameworks for Concurrent Data Structures
by rex
Ravil Galiev, ITMO University. Michael Spear, Lehi...
Chapter 6: The Normal Distribution
by briggs522
6-4: Checking for Normality. Normally distributed...
V10 - 8. Gene Expression
by emery
Regulation of Gene Transcription at Promoters. Exp...
Frequency Distribution of GOES Solar Flare Peak Fluxes from 1994 to 2005
by candy
Nicholas Shields. SESI Presentation – CUA Studen...
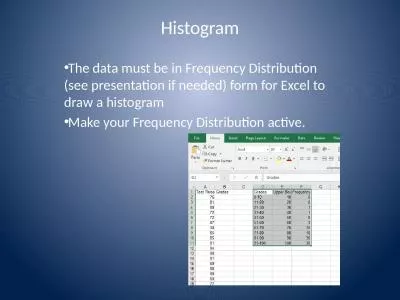
Histogram The data must be in Frequency Distribution (see presentation if needed) form for Excel to
by bitsy
Make your Frequency Distribution active.. Histogra...
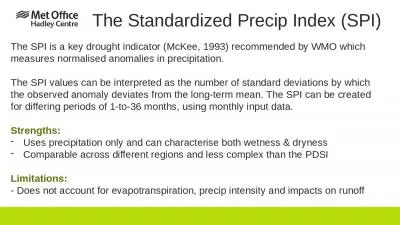
The Standardized Precip
by madeline
Index (SPI). The SPI is a key drought indicator (M...
Representation of Data Department of Geography
by valerie
Statistical diagrams. Statistical diagrams covers:...
Frequency Analysis Reading: Applied Hydrology Sections 12-2 to 12-6
by molly
2. Frequency analysis for extreme events . If you ...
FREQUENCY DISTRIBUTION AND GRAPHICAL PRESENTATION OF DATA
by helene
BY. Manisha Kadam. The arrangement of data in diff...
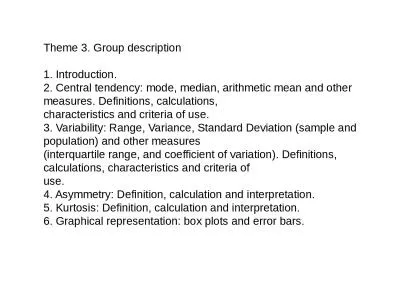
Theme 3. Group description
by sadie
1. Introduction.. 2. Central tendency: mode, media...
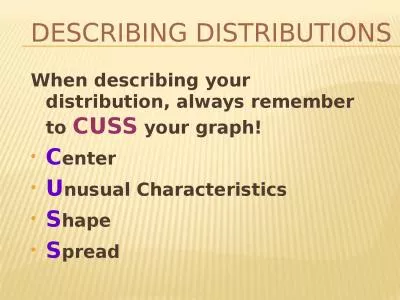
Describing Distributions
by roy
When describing your distribution, always remember...
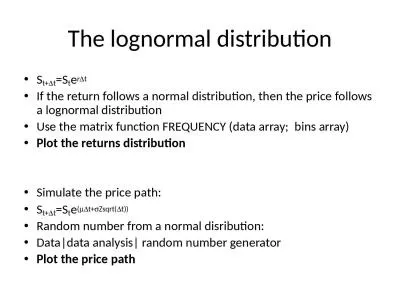
The lognormal distribution
by badra
S. t+. D. t. =. S. t. e. r. D. t. If. the . retur...
Distribution System State Estimation and Smart Meter Analysis
by naomi
Instructor: Dr. . Zhaoyu. Wang. GRA: . Dingwei. ...
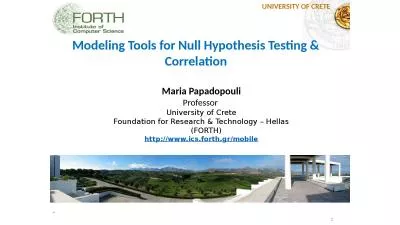
Maria Papadopouli Professor
by harper
University of Crete. Foundation for Research &...
Distribution list Disclaimer
by yvonne
Please note that all data contained within is prov...
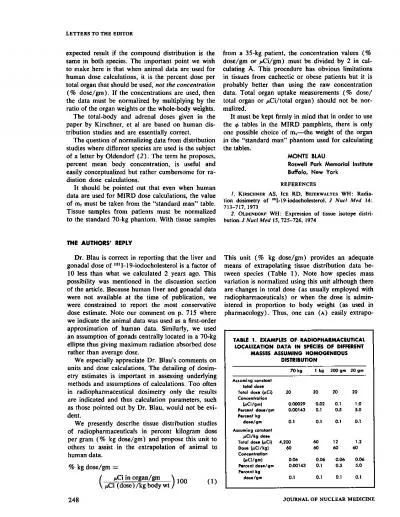
distribution
by angelina
70kg 1 kg 200gm 20gm LETTERS TO THE EDITOR expecte...
Class 1: Probability & Statistics
by SunnySailor
In this class we will review . how statistics are ...
Load More...