Explore
Featured
Recent
Articles
Topics
Login
Upload
Featured
Recent
Articles
Topics
Login
Upload
Search Results for 'charts data'
charts data published presentations and documents on DocSlides.
Welcome to Class 12 The Performance Scorecard &
by trish-goza
Chapters 10 & 11. And. LAB DAY # 1. PSC. . ...
Chapter 2E: Uses and Abuses of Statistics
by debby-jeon
Objective: . To identify common errors and misuse...
1.3:
by lindy-dunigan
Uses and Abuses of Statistics. Objective: . To id...
Miranda Li
by kittie-lecroy
Design & Data Visualization Lead. Microsoft C...
Methods Criteria and Performance
by min-jolicoeur
Patricia Nedialkova, Ph.D., TTB. International . ...
National Immunization Partnership with the APA (NIPA)
by kittie-lecroy
Wave 3. A Quality Improvement Project Specific to...
Chapter 15 : Communicating Evidence Visually
by stefany-barnette
Masoomah. Al . Zaher. . - . Afaf. . AlThinayy...
BANGALORE
by jane-oiler
Who is BIRT?. Solving Your Data . Visualization N...
Illustrating with Pictures and Information Graphics
by jane-oiler
Chapter 2. 1. Student Learning Outcomes. Case Stu...
Designing with the User in mind
by tatiana-dople
Jamie Starke. Sizing the Horizon: The Effects of ...
Radar Charts!
by pamella-moone
Sheena . Ellenburg. Outline. Overview. Characteri...
CTI Solutions
by test
in partnership with Jefferson Hospital . Establis...
Document Management
by faustina-dinatale
April. . 2. 4. , 201. 5. Presented by: . Susan M...
1.3:
by test
Uses and Abuses of Statistics. Objective: . To id...
Marie-France Mardi,
by cheryl-pisano
Marketing Data Analyst,. RSPB Supporter Engagemen...
Managing Data Collection Functions in a Changing Environmen
by faustina-dinatale
By Ms Adeline Ng (Deputy Director, Collection) . ...
A Quick Introduction to d3.js & Reusable Charts
by tatiana-dople
Adam. . Pere. Olin College, November 11. th. . ...
Using Microsoft Excel
by olivia-moreira
®. Pivot Tables to Turn Institutional Data into...
Overview
by tawny-fly
plot in 2D. Plot in 3D. Other possible charts. En...
Pipeline Commander
by sherrill-nordquist
Technical Presentation. Introduction. MCS Pipelin...
1 Excel Lesson
by yoshiko-marsland
5. Working with Multiple Worksheets. and . Chart...
9d .
by tatiana-dople
Pie Charts. CSCI N207 Data Analysis Using Spreads...
Basics of Data
by stefany-barnette
Representation. The Search For Well-Designed, Use...
MODULE 5: RHIS Data Analysis SESSION 1: Key
by yoshiko-marsland
MODULE 5: RHIS Data Analysis SESSION 1: Key Concep...
Constructing pie charts from different data
by danika-pritchard
Constructing pie charts from different data repres...
Profit improvement analysis
by clay
David Goldstein. President, . Mekko. Graphics. da...
X-bar and R charts Example 3.1
by susan
from . older text. 1. Data on part thickness. T...
(BOOS)-Learn Excel 2007 through Excel 2010 From MrExcel: Master Pivot Tables, Subtotals, Charts, VLOOKUP, IF, Data Analysis and Much More - 512 Excel Mysteries Solved
by kashernoble
The Benefits of Reading Books,Most people read to ...
(BOOK)-Meaningful Graphs: Converting Data into Informative Excel Charts
by lonzellruss
The Benefits of Reading Books,Most people read to ...
(BOOS)-Power Excel with MrExcel: Master Pivot Tables, Subtotals, Charts, VLOOKUP, IF, Data Analysis in Excel 2010?2013
by lonzellruss
The Benefits of Reading Books,Most people read to ...
Data at Work: Best practices for creating effective charts and information graphics in Microsoft Excel (Voices That Matter)
by thadeusdenym
It’s no secret that this world we live in can be...
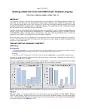
x0000x00001 xMCIxD 0 xMCIxD 0 Paper HW2013Building
by eve
From Wikipedia bar chartor bar graphis a chart wit...
Peace Airshed Zone Association
by mackenzie
Ambient Air Monitoring Network SummaryAmbient Air ...
Peace Airshed Zone Association
by ashley
Ambient Air Monitoring Network SummaryAmbient Air ...
ALLPPT.com _ Free PowerPoint Templates, Diagrams and Charts
by serenemain
Impact Evaluation: . Pros . & Cons. GMEF FORUM...
No. Nama Tim Judul Ide 1
by eatsyouc
TIM SIMPRU. Sistem Informasi Peminjaman Ruangan IT...
Statistical Fundamentals
by chiquity
: . Using Microsoft Excel for . Univariate. and B...
Oracle Application Express 5.1
by pasty-toler
Oracle Application Express 5.1 New Features [Name...
Statistical Fundamentals
by pamella-moone
: . Using Microsoft Excel for . Univariate. and ...
HEATING, COOLING & WATER HEATING PRODUCTS
by yoshiko-marsland
DSQR Training. Statistical Process Control. Ted F...
Load More...