Search Results for 'chart visual'
chart visual published presentations and documents on DocSlides.
Research for a reason. CHARTS AND VISUALIZATIONS
by kittie-lecroy
Percentage of Total NSF . Research . Funding. YEA...
Effective Visuals Using Graphs, Tables, Charts, and illustrations in Technical Reports
by smith
S. Last ENGR 120. VISUALS. Capture and hold . peo...

Visual Aids Cornell Note Set-up
by limelighthyundai
Date: . February 15. Topic: . Visual Aids. Essenti...

Visualization of Student Migration Data Using Google Charts
by jane-oiler
Diagrams. Sean V. Hoffman. Institutional Research...

Visualization of Student Migration Data Using Google Charts Sankey
by natalia-silvester
Diagrams. Sean V. Hoffman. Institutional Research...

2012 National BDPA Technology Conference
by olivia-moreira
Creating Rich Data Visualizations using the Googl...
Examination Procedure : Acuity of vision
by jasmine
Colour vision. Field of vision. Ocular motility an...
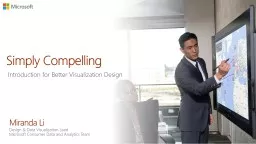
Miranda Li Design & Data Visualization Lead
by lauren
Microsoft Consumer Data and Analytics Team. Simply...
The historical perspective of Visual Acuity Assessment in optometry
by mercynaybor
Presented at the . 37. th. . Session of Nigerian ...

2012 National BDPA Technology Conference
by ellena-manuel
Creating Rich Data Visualizations using the Googl...
Quick & Easy Data Visualization
by mitsue-stanley
with Google . Visualization API . + Google Chart ...

New Data Visualization Techniques With MS SQL Server 2008 R
by lois-ondreau
Name: Marie Wessels. Title: Consultant. Company...
What you need to know about an Eye Exam
by liane-varnes
By: Satya . Moolani. Visual Acuity Test. 1. Visua...
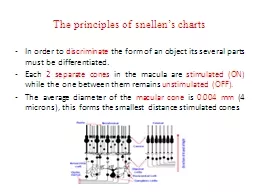
The principles of snellen’s charts
by lindy-dunigan
In . order to . discriminate. the form of an obj...
Storytelling with Charts: A Data & Text Visualization Guide for Business, Professionals and Non-Professionals: A tutorial to quickly master the art and science of telling engaging stories with charts
by quinceyzaaalan
It’s no secret that this world we live in can be...

Black Belt Project Storyboard Template
by liane-varnes
Can be used in combination with. Black Belt Story...
Beginners Guide to Data Visualization: How to Understand, Design, and Optimize Over 40 Different Charts (Guides for Data Analytics, Data Visualization, and Communicating Data)
by judenmasson
It’s no secret that this world we live in can be...


One- to two-dimensional visualization
by unisoftsm
Chong Ho Alex Yu. What is dimension?. A graphical ...




Designing with the User in mind
by tatiana-dople
Jamie Starke. Sizing the Horizon: The Effects of ...

Department of Biology Student Name, Student Name, & Student Name
by pamella-moone
Faculty Advisor, Faculty Department. Section Hea...


Instructions for use This resource is not a
by min-jolicoeur
Instructions for use This resource is not a teachi...

Next Generation G1000 Avionics
by alexa-scheidler
Garmin overhauled the G1000 avionics suite. Signi...

hey didn146t change the VASI so it will remain as currently charted
by candy
and to 4 NM from the runway threshold
They changed...

[READ] - Say It With Charts: The Executive\'s Guide to Visual Communication
by Anthony
Step-by-step guide to creating compelling, memorab...

Kern County Public Health Services Department
by freya
CHDP. Online Vision Screening Training . Objective...

Effective Data Visualization: The Right Chart for the Right Data
by giorgibennett
Community Manager: Principiante a Experto (Marketi...