Explore
Featured
Recent
Articles
Topics
Login
Upload
Featured
Recent
Articles
Topics
Login
Upload
Search Results for 'chart control'
chart control published presentations and documents on DocSlides.
Attribute Control Chart
by isabella2
Dr.. Raghu . Nandan. . Sengupta. Professor. Depa...
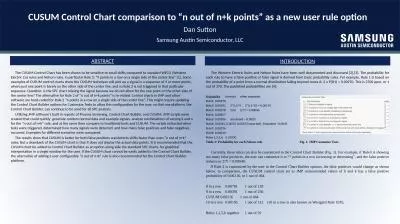
CUSUM Control Chart comparison to “n out of
by fanny
n+k. . points” as a new user rule option. Dan S...
A Flexible Statistical Control Chart
by phoebe-click
for . Dispersed Count . Data. Kimberly F. Sellers...
A Flexible Statistical Control Chart
by cheryl-pisano
for . Dispersed Count . Data. Kimberly F. Sellers...
Cumulative Sum Chart Dr.
by barbara
Raghu . Nandan. . Sengupta. Professor. Department...
Bar Chart You can launch
by morton
Gtplot. from . GSS. to create Bar Charts and oth...
Pareto Chart QM 2017 2/1/2017
by brown
Lean Six Sigma. 1. What is Pareto Chart?. A . Pare...
Statistical Process Control
by lindy-dunigan
Operations Management. Dr. . Ron . Lembke. Design...
Variables Data Statistical Process Control
by liane-varnes
Click Here . to Begin . Introduce Statistical Pro...
Statistical Process Control
by lois-ondreau
Operations Management. Dr. . Ron . Lembke. Design...
Statistical Process Control
by sherrill-nordquist
Operations Management. Dr. . Ron . Lembke. Design...
Statistical Process Control
by conchita-marotz
Managing . for Quality. Dr. Ron . Lembke. Goal of...
Statistical Process Control
by trish-goza
PowerPoint presentation to accompany . Heizer and...
Control Charting:
by pamella-moone
Lessons Learned Along the Way. Why, What, and How...
HEATING, COOLING & WATER HEATING PRODUCTS
by yoshiko-marsland
DSQR Training. Statistical Process Control. Ted F...
CBE 491
by jane-oiler
/ . CBE 433. 3 Dec 2012. 1. Statistical Process C...
6 Managing Quality
by phoebe-click
PowerPoint presentation to accompany . Heizer and...
Short Run SPC
by calandra-battersby
ASQ Portland Section 0607. By Ed Landauer, C.Q.E....
The 7 Basic Tools of Quality
by test
(Ishikawa Tools of Quality). FREE Professional De...
Learning Objectives for Unit-5
by phoebe-click
After careful study of this chapter, you should b...
강의 : 강봉원 010-8367-7357
by calandra-battersby
kang@cg-gil.com. QC 7. 가지 도구 활용. 숫�...
Managing Quality Chapter 3
by ani
Quality and Performance. Quality. A . term used by...
X-bar and R charts Example 3.1
by susan
from . older text. 1. Data on part thickness. T...
Essential QI Tools Review of
by finley
QI 104: Interpreting Data: Run Charts, Control Cha...
Make Better Charts Kristin Briney
by cadie
BBE Librarian. https://xkcd.com/1798/. It’s not ...
Project Management Project Management
by yoshiko-marsland
DILBERT’S. BOSS. A Balancing Act. Deliverab...
Autonomous Underwater Robots
by celsa-spraggs
. Progress Presentation. Ryan Lipski, Cameron Pu...
Quality Control Chapter 10
by giovanna-bartolotta
McGraw-Hill/Irwin. Copyright © 2012 by T...
Quality Control
by marina-yarberry
Chapter 10. MIS 373: Basic Operations Management....
ILPQC Neonatal Breakout Session
by ella
November 3rd 2016. Agenda. Welcome and introductio...
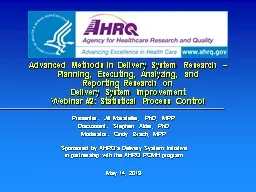
Advanced Methods in Delivery System Research –
by min-jolicoeur
Planning, Executing, Analyzing, and . Reporting R...
© 2011 Pearson Education, Inc. publishing as Prentice Hall
by liane-varnes
S6. Statistical Process Control. PowerPoint prese...
ORGANISATION AND STRUCTURE
by min-jolicoeur
CHAPTER-7. (1. st. half). Done by – . Yuvraj.M...
Advanced Methods in Delivery System Research –
by celsa-spraggs
Planning, Executing, Analyzing, and . Reporting R...
Attributes Data Binomial and Poisson Data
by pasty-toler
1. Discrete Data. All data comes in Discrete form...
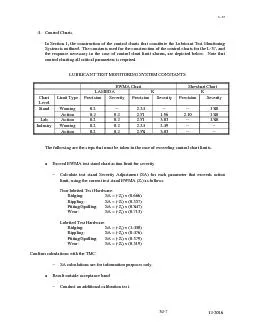
L37122016 327 4 Control Charts In Section 1 the construction
by candy
LAMBDA K K Limit Type Precision Severity Precisio...
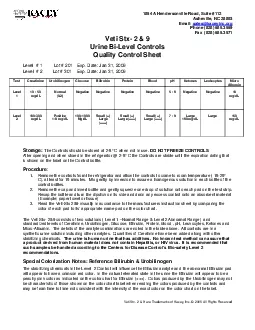
1854 A Hendersonville Road
by holly
Suite 112Asheville NC 28803Email saleskaceyincorgP...
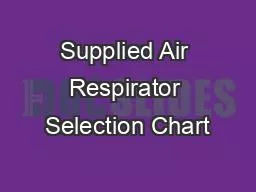
Supplied Air Respirator Selection Chart
by gelbero
DC seriesFAMB Choose style application Choose h...
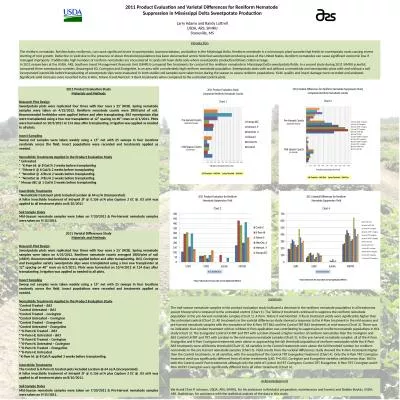
2011 Product Evaluation and Varietal Differences for
by morgan
Reniform. Nematode . Suppression in Mississippi D...
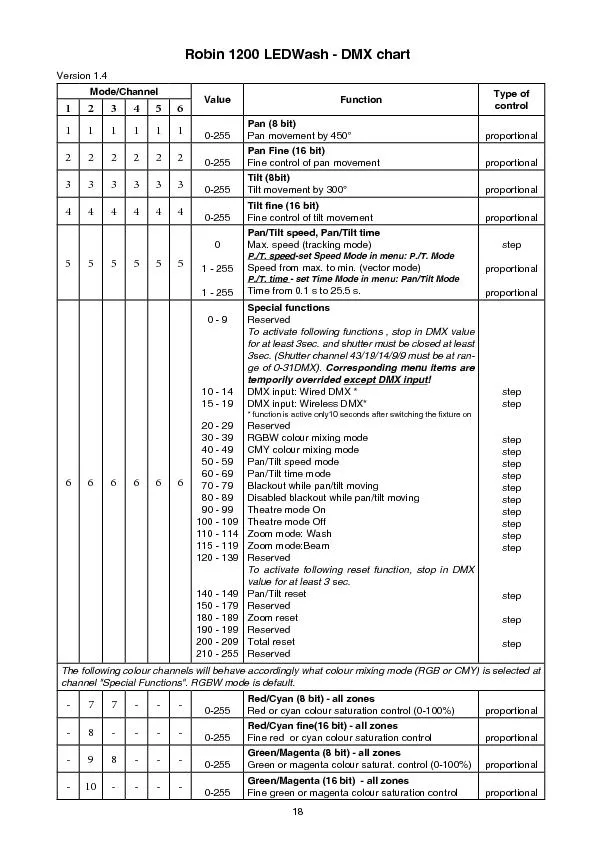
Robin 1200 LEDWash - DMX chart
by debby-jeon
18 Version 1.4 Mode/Channel Value Function Type of...
Load More...