Explore
Featured
Recent
Articles
Topics
Login
Upload
Featured
Recent
Articles
Topics
Login
Upload
Search Results for 'chart bar'
chart bar published presentations and documents on DocSlides.
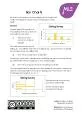
Identify information from atypical bar charts
by susan2
This chart shows the times when 5 children were at...
Profit improvement analysis
by clay
David Goldstein. President, . Mekko. Graphics. da...
How to present data or results in Thesis?
by thatcher
Dr.Leeberk Raja MBBS.,MD. Consultant, Division of ...
SLIDES
by test
. .. . BY. John Loucks. St. . Edward’s. Unive...
John Loucks
by natalia-silvester
St. . Edward’s. University. .. .. .. .. .. .. ....
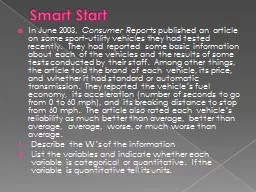
Smart Start In June 2003,
by conchita-marotz
Consumer Reports. published an article on some s...
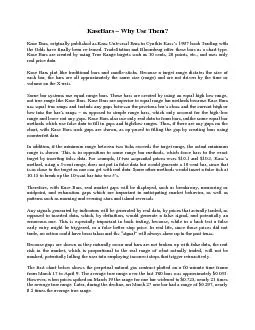
Why Use Them
by emmy
KaseBars – Kase Bars, originally published as K...
Class – B.Com -II semester
by fiona
Subject-Business Mathematics. Topic-Sub Divided Ba...
SPC in 3 Steps Robert Fruit
by gagnon
American Society of Quality. Certified Six Sigma B...
Tool Time! Tips for Viewing This Presentation
by rose
Skip to other slides in the presentation. Read alo...
Dr Eleanor Lingham
by belinda
Author De Montfort University Moderator Dr Julie C...
Which
by pasty-toler
Chart . or . Graph . is . Right . for . You. ?. B...
Chapter 10
by stefany-barnette
STA 200 . Summer I . 2011. Data Tables. One way ...
Misleading Graphs and Statistics
by cheryl-pisano
Thanks to Mr. Hammond @ . www.mrhammond.org/math/...
Using Technical Analysis to
by lois-ondreau
Improve Your Profitability. Presented by. Andrew ...
Misleading Graphs
by liane-varnes
Misleading Graphs. Good . graphs are extremely po...
Demonstrating Improvements
by trish-goza
Control . Kaizen . Facilitation. Objectives. Unde...
Who Am I?
by luanne-stotts
Interdisciplinary Project. G. oal - . Gain an und...
Presentation Title Line Two
by ellena-manuel
Speaker Name. March 18, 2015. Speaker Title. A li...
SWAY BAR DIAMETER CONVERSION CHARTThe below chart is an indicative gui
by danika-pritchard
BL - 281AUGUST 2011 FOLLOW WHITELINE www.facebook...
Reference:
by luanne-stotts
Technical Analysis of the Financial Markets. By J...
Time-
by tatyana-admore
Chainage. diagram. Sewon Kim, Kevin Tran, Mary S...
Graphs and Charts
by conchita-marotz
Curriculum links and teaching notes. For L1-L2 Ad...
Articulation Development ChartIn the chart below, each solid bar indic
by stefany-barnette
What sounds should my child be saying? Girls Boys ...
Financial Modeling
by min-jolicoeur
Fundamentals. Data Collection. Graphing. Rates of...
Displaying Data &
by lois-ondreau
Result . Interpretation . Dr. . Nawaporn. . Wisi...
Other Types of Graphs
by alexa-scheidler
2-3. In addition to the histogram, the frequency ...
Analyzing Two-Variable Data
by adia
Lesson 2.1. Relationships Between Two. Categorical...
10 finance charts
by kameron
Income Statement Results . Description. Walk the a...
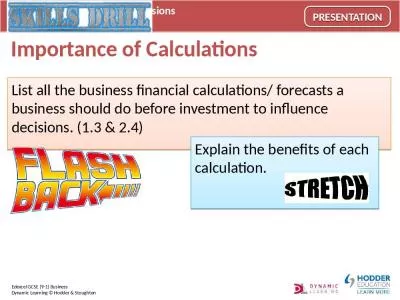
Importance of Calculations
by jefferson
List all the business financial calculations/ fore...
Welcome to Maths at Joyce Frankland Academy.
by genevieve
What equipment will I need to bring with me on my ...
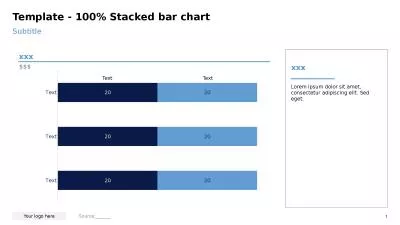
Subtitle Template - 100% Stacked bar chart
by anastasia
xxx. $$$. Source:_______. xxx. Lorem ipsum dolor s...
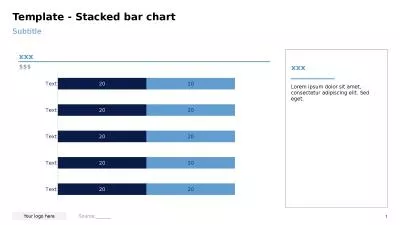
Subtitle Template - Stacked bar chart
by felicity
xxx. $$$. Source:_______. xxx. Lorem ipsum dolor s...
Head and Neck Cancer 5 Year follow
by CuriousCatfish
u. p . Audit of patient outcomes. Tom Walker. Head...
Variation S3 Science Outcomes and Experiences
by DaintyLittlePrincess
By exploring the characteristics offspring inherit...
axiUm 6.0 The Upgrade Help is available with 2
by roberts
options:. axiUm. Help File button opens company w...
How to make plots in Minitab
by aaron
Prof. Eric A. Suess. Graphs for one variable. Pie...
Global Citizenship Challenge
by amey
Lesson 4. Lesson Objective – Nod y . wers. To . ...
Common Cause Variation Sampling and Process Monitoring
by mitsue-stanley
1. Attributes of Common Cause Variation. It is th...
CS 5163 Introduction to Data Science
by test
Part 2: Plotting, basic statistics. 2.1 Basic plo...
Load More...