Explore
Featured
Recent
Articles
Topics
Login
Upload
Featured
Recent
Articles
Topics
Login
Upload
Search Results for 'bar graph'
bar graph published presentations and documents on DocSlides.
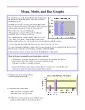
Represent and Interpret Data
by faustina-dinatale
2.MD.10. 35. 30. X. 25. X. 20. X. 1. 2. 3. 4. KEY...
How to make plots in Minitab
by aaron
Prof. Eric A. Suess. Graphs for one variable. Pie...
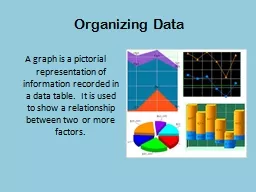
Organizing Data
by tawny-fly
A graph is a pictorial representation of informat...
Graphs and Charts
by conchita-marotz
Curriculum links and teaching notes. For L1-L2 Ad...
s Bar Graph. Show your work in the box andyou're your answer on the li
by test
orange
Demonstrating Improvements
by trish-goza
Control . Kaizen . Facilitation. Objectives. Unde...
Creating Accessible Presentations
by tatyana-admore
We hope these sample slides will help you create ...
Chapter 1: Exploring Data
by giovanna-bartolotta
Section 1.1. Analyzing Categorical Data. The Prac...
Creating Accessible Presentations
by trish-goza
We hope these sample slides will help you create ...
Air Resources Board California Environmental Protection Agency
by lindy-dunigan
8/8/2013. Division Name Here. 8/8/2013. Division ...
Visualizing your data effectively
by min-jolicoeur
Kim Unger – Fall 2017. About me. Senior Analyti...
More Chapter 3! (or Chapter 4)
by phoebe-click
Brave New Data. We are no longer limited to chart...
Communicating Research Introductions
by karlyn-bohler
How to conduct a literature search. Types of data...
Financial Modeling Data Collection & Integration
by giovanna-bartolotta
Graph. Rates of Return. Efficient Portfolio . Fro...
Impulse Forcing Functions
by stefany-barnette
MAT 275. Sometimes, energy is contributed into a ...
21 st Century Lessons Statistical Questions and Representation
by pamella-moone
Mrs. Thompson Level 1. 1. 2. Lesson Objective. SW...
Cells Create a Bar Graph
by kittie-lecroy
Amount of Education. Average Yearly Salary. No Hi...
Analyzing Two-Variable Data
by adia
Lesson 2.1. Relationships Between Two. Categorical...
4 These are the spelling test sc
by megan
r strawberry, vanill chocolate chip, choc...
Pareto Chart QM 2017 2/1/2017
by brown
Lean Six Sigma. 1. What is Pareto Chart?. A . Pare...
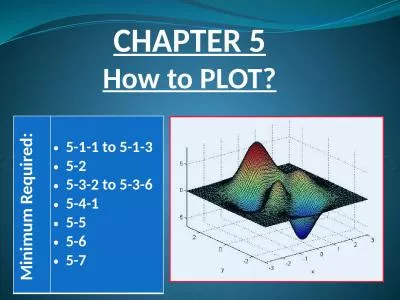
CHAPTER 5 How to PLOT? Minimum
by sadie
Required: . 5-1-1 to 5-1-3. 5-2. 5-3-2 to 5-3-6. 5...
Intro. to Data Visualization
by jocelyn
S. imple Graphs in Python. using. matplotlib. and...
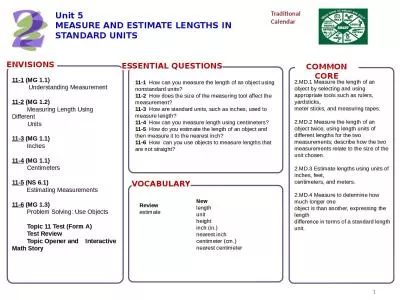
1 COMMON CORE ENVISIONS
by mia
Unit 5. MEASURE AND ESTIMATE LENGTHS IN STANDARD U...
Going to the movies Making decisions
by bery
Going to the movies – Frequency tables. Class in...
Load More...