Explore
Featured
Recent
Articles
Topics
Login
Upload
Featured
Recent
Articles
Topics
Login
Upload
Search Results for 'Data-Interpret'
Data-Interpret published presentations and documents on DocSlides.
ABG Interpretation 1 ABG INTERPRETATION
by liane-varnes
AHMED BAMAGA. MBBS. King Abdulaziz University Ho...
Outlier Description and Interpretation
by playhomey
Jian Pei. JD.com. & Simon Fraser University. ...
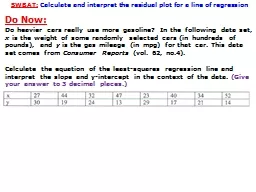
SWBAT: Calculate and interpret the residual plot for a line of regression
by lois-ondreau
Do Now:. Do heavier cars really use more gasoline...
Interpretive Sociology
by alexa-scheidler
Meaning is the key to learning . about . humans a...
Failures in interpretation of sequencing results
by danika-pritchard
v1.0. Laura Biggins. Interpretation. Library. Con...
How to Prepare for Hitachi Vantara HQT-2225 Certification?
by NWExam
Start here--- https://shorturl.at/diI25 ---Get com...
Cohesity COH100 Exam Prep: Important Questions with Answers
by NWExam
Start here---https://shorturl.at/ZPRp9---Get compl...
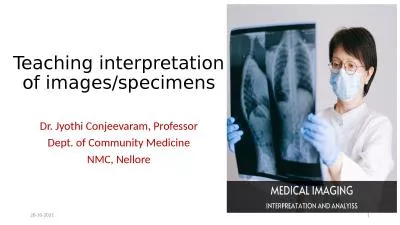
Teaching interpretation of images/specimens
by phoebe
Dr.. . Jyothi. . Conjeevaram. , Professor. Dept....
INTERPRETATION OF STATUTES
by bella
1. INTERPRETATION OF STATUTES . Bangalore Water Su...
BIRS 2016: Opening the analysis black box: Improving robustness and interpretation
by ChubbyBunny
Matthew Brown, PhD. University of Alberta, Canada....
Interpretation 101 Amos
by TheCookieMonster
Almy. Interpretive Specialist. Rockport and Rasar ...
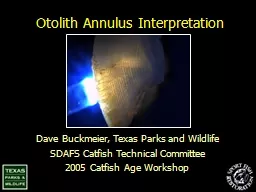
Otolith Annulus Interpretation
by cady
Dave Buckmeier, Texas Parks and Wildlife. SDAFS . ...
Interpretation NAI was forme
by alis
By Dave Both the NAI and the NPS have recently beg...
Cultural Interpretation
by violet
Cultural Interpretation courses engage students in...
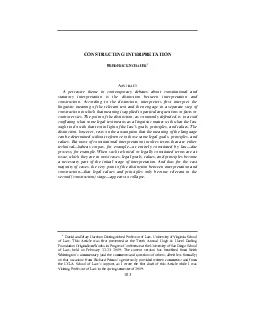
103CONSTRUCTING INTERPRETATION REDERICK CHAUERBSTRACTA pervasive theme
by finley
David and Mary Harrison Distinguished Professor of...
What is Interpretation
by cadie
An overview of Interpretive Philosophy and Princip...
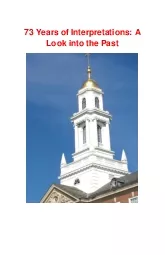
73 Years of Interpretations A
by winnie
Look into the PastInterpretations73 Years of Inter...
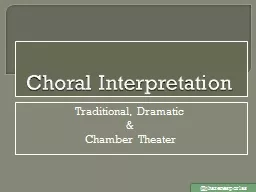
Choral Interpretation Traditional, Dramatic
by frostedikea
&. Chamber Theater. @. jhazenesporlas. Tradit...
What is the ‘best interpretation of will and preferences’?
by sialoquentburberry
Paul Skowron. University of York. paul.skowron@yor...
August 2011 Interpreting in Palliative Care
by briana-ranney
1. Interpreting in Palliative Care. Produced with...
Static vs. Dynamic interpretation
by min-jolicoeur
PANEL. Judge Dr . Manuel . Hallivis-Pelayo (Méxi...
Statutory Interpretation 2
by ellena-manuel
‘The true meaning of a legal text almost always...
Translation & Interpreting
by debby-jeon
Übersetzen & Dolmetschen. Sarah Allen, . Wun...
Interpreter Services Program
by yoshiko-marsland
Kathy Templet/Anthony Pheasant. Program Specialis...
CONTRACTS Chapter 4. Contract Interpretation
by briana-ranney
Ch.4.D. Interpretation. 1. Contract Interpretatio...
Idaho Sign Language Interpreter Licensure
by cheryl-pisano
Information Sharing. May 29, 2014. 1. Task Force ...
Oral Interpretation Discussion Starter
by lois-ondreau
“Above all, the art of reading aloud should be ...
Statutory interpretation
by aaron
Statutory. . interpretation. Approaches to judic...
HUMOROUS INTERPRETATION *Dramatic
by sherrill-nordquist
and humorous interpretation are to be defined as ...
Validation and Interpretation in Cellular Pathology
by tawny-fly
Sarah Dean. Lecture Overview. Types of Samples. T...
Statutory Interpretation
by trish-goza
Objectives. Explain. what is meant by the intent...
Dream Interpretation
by calandra-battersby
Ellen Krajcir. Penn State University. About Dream...
T he Python interpreter
by alexa-scheidler
CSE 160. University of Washington. Ruth Anderson....
Interpretations
by debby-jeon
Matthew 15:3-9. Man’s Interpretations. Interpre...
Interpretive Quality Assurance In Pathology: Where Is The C
by sherrill-nordquist
State And Future Direction. In Canada?. Maritime...
More on Pronoun Interpretation in Children
by faustina-dinatale
Why all the fuss about pronouns?. Children (age &...
The Importance of Biblical Interpretation
by tatyana-admore
Anthony Casey and Rob Plummer. Who interprets the...
The Interpretation of Dreams
by liane-varnes
Lesson 02: Interpreting Dreams…. Starter: . Wha...
The Science of Interpretation
by alida-meadow
HERMENEUTICS. People cringe at the word “theolo...
Working with Interpretations of Thatcher
by alexa-scheidler
Producing a good piece of coursework. Learning Ob...
Load More...