Explore
Featured
Recent
Articles
Topics
Login
Upload
Featured
Recent
Articles
Topics
Login
Upload
Search Results for '2050-Figure'
2050-Figure published presentations and documents on DocSlides.
Heat Roadmap Europe 2050
by lois-ondreau
study for the EU27. by. for. Aalborg University ....
Vision 2050
by ellena-manuel
Generic Presentation . Short Version. March 2010....
Millennium Project Work&Tech 2050 study
by natalia-silvester
with the Basque Government. Ibon Zugasti. Millenn...
Industrial 2050 Roadmaps
by ellena-manuel
Industrial 2050 Roadmaps. Objectives. Understand ...
Towards Sustainable Cooling by 2050: Developing a Global Roadmap
by saul
Developing a Global Roadmap. Johannes Heister. Wor...
Key findings of World Population Prospects 2022
by Mindbender
Presentation by . Mr. John Wilmoth . Director, Pop...
A Roadmap for the
by ethlyn
Net Zero by 2050Global EnergySectorNet Zero by 205...
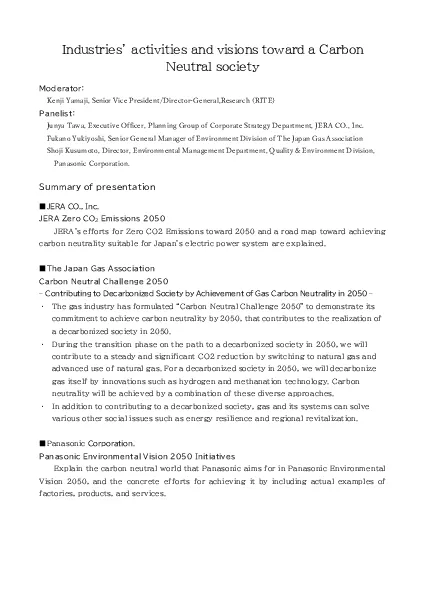
Industries146 activities and visions toward a Carbon Neutral societyod
by hadly
Junya TawaExecutive Officer Planning Group of Corp...
Elsevier Editorial Systemtm for Energy Policy
by ella
Manuscript Draft Manuscript Number: JEPO - D 12 - ...
100% Renewable Energy by 2050
by asmurgas
Presentation to the District of Sooke . Committee ...
GoGreen – Missi o on 2050:
by envrrolex
null. . emissio. oni. Laire Suurväli – Kvalite...
Implications, adaptations & policies for economic development
by olivia-moreira
Presented by . Johann Bell. This presentation is ...
1 The Renewable
by ellena-manuel
Energy . Transition. Implications for Supply Chai...
Agrimonde
by marina-yarberry
-. Terra. INTERNATIONAL CONFERENCE. Friday . June...
South Africa’s Intended Nationally Determined Contributio
by kittie-lecroy
Greenpeace is an independent, global campaigning ...
F uture
by min-jolicoeur
Energy Scenarios . . 2016. . – Pathways towar...
Impact of 2000-2050 climate change on
by alexa-scheidler
PM. 2.5. . air quality inferred from a multi-mod...
The Canadian Energy Research Institute and
by tatyana-admore
Friends . of AIMS . Present:. . Allan Fogwill . ...
Multi-culturalism
by cheryl-pisano
in the. US. Eric Flaxman. US Embassy Warsaw. Apri...
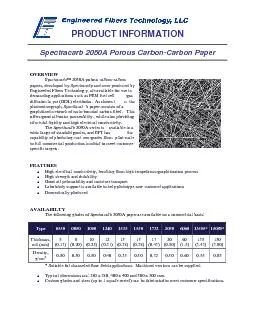
PRODUCT INFORMATION Spectracarb 2050A Porous Carbon-Carbon Paper ...
by alida-meadow
OVERVIEW Spectracarb™ 2050A porous carbon-car...
Fundamentals of sustainable energetic. (October 2011)
by sherrill-nordquist
. Energy . C. onsumption. . and Energy Sources ...
The 6 step
by calandra-battersby
m. ethod of developing a thesis from a . p. rompt...
Figure 2Tech NotesGround/Radial SystemsGROUND MOUNTINGA vertical anten
by trish-goza
-1- Figure 1 -2- Figure 3 Figure 4 Figure 5loss re...
P WERFUELS in a Renewable Energy World Global Volumes Costs and Tr
by pamela
150Publisher Deutsche Energie-Agentur GmbH denaGer...
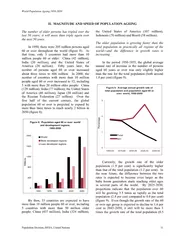
World Population Ageing 1950-2050Population Division, DESA, United Nat
by natalia-silvester
Figure 8. Population aged 60 or over: world and d...
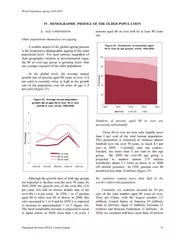
World Population Ageing 1950-2050Population Division, DESA, United Nat
by pasty-toler
Figure 23. Average annual population growth rate ...
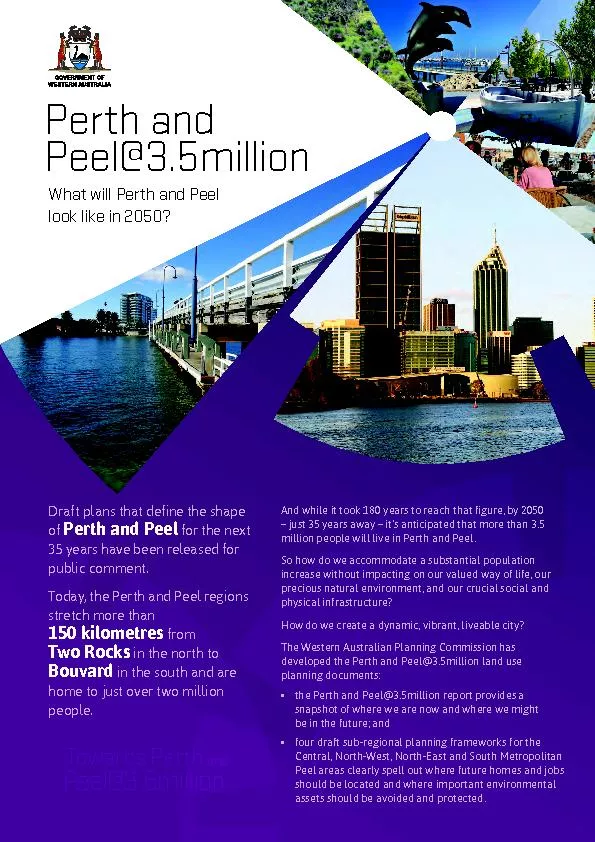
Towards PerthandPeel@3.5million
by lindy-dunigan
PERTH AND PEEL@3.5MILLION TO 2050 Figure 6: Perth ...
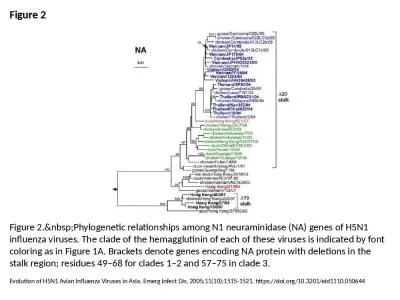
Figure 2 Figure 2. Phylogenetic relationships among N1 neuraminidase (NA) genes of H5N1 in
by martin
Evolution of H5N1 Avian Influenza Viruses in Asia....
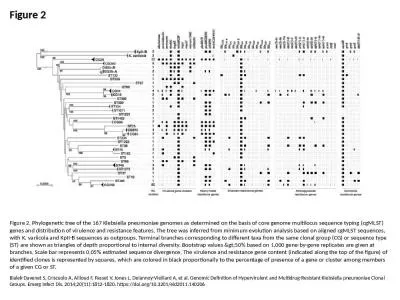
Figure 2 Figure 2. Phylogenetic tree of the 167 Klebsiella pneumoniae genomes as determined on the
by elise
Bialek-Davenet S, Criscuolo A, Ailloud F, Passet V...
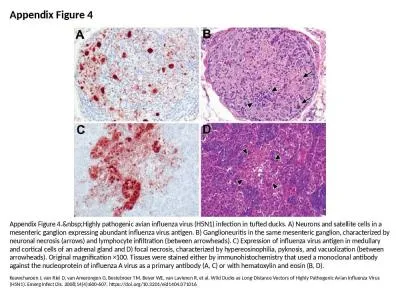
Appendix Figure 4 Appendix Figure 4. Highly pathogenic avian influenza virus (H5N1) infect
by elizabeth
Keawcharoen J, van Riel D, van Amerongen G, Besteb...
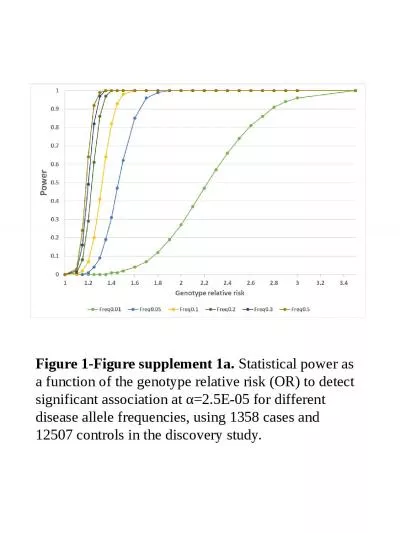
Figure 1-Figure supplement 1a.
by piper
Statistical power as a function of the genotype re...
Figure 1 Figure 1. Phylogenetic tree of hemagglutinin (HA) segments from 36 avian influenz
by audrey
Salzberg SL, Kingsford C, Cattoli G, Spiro DJ, Jan...
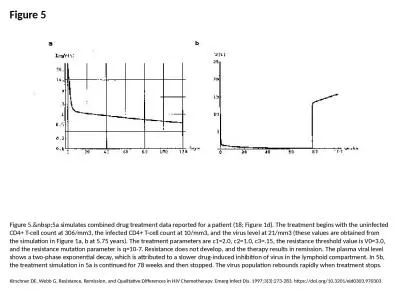
Figure 5 Figure 5. 5a simulates combined drug treatment data reported for a patient (18; F
by ximena
Kirschner DE, Webb G. Resistance, Remission, and Q...
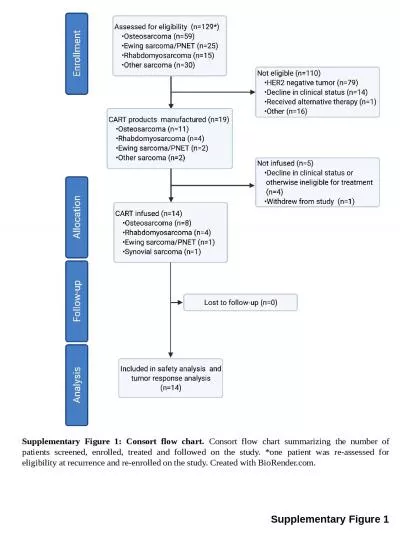
Supplementary Figure 1 Supplementary Figure 1: Consort flow chart.
by leah
Consort flow chart summarizing the number of patie...
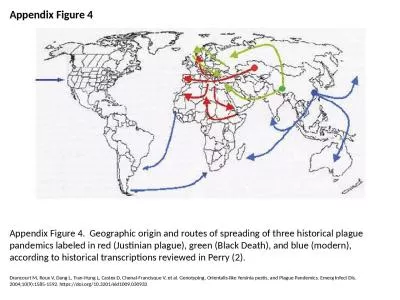
Appendix Figure 4 Appendix Figure 4. Geographic origin and routes of spreading of three historical
by naomi
Drancourt M, Roux V, Dang L, Tran-Hung L, Castex D...
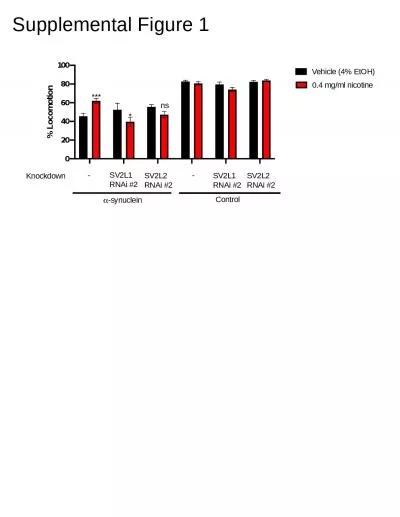
Supplemental Figure 1 Supplemental Figure 2
by evelyn
A.. B.. Supplemental Figure 3. Control. α-synucle...
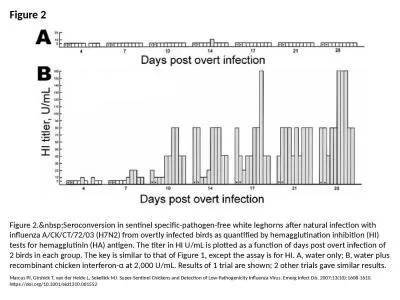
Figure 2 Figure 2. Seroconversion in sentinel specific-pathogen-free white leghorns after
by taylor
Marcus PI, Girshick T, van der Heide L, Sekellick ...
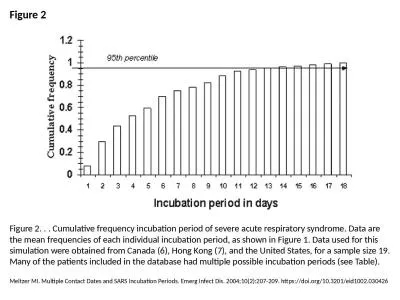
Figure 2 Figure 2. . . Cumulative frequency incubation period of severe acute respiratory syndrome.
by skylar
Meltzer MI. Multiple Contact Dates and SARS Incuba...
Figure 1 Figure 1. A. Bronchial tissue Gram stain showing intrahistiocytic coccobacillary forms o
by scarlett
Linder R. Rhodococcus equi and Arcanobacterium hae...
Figure 2 Figure 2. . Minimum spanning tree generated from variable number tandem repeat (VNTR) data
by finley
Rhyan JC, Nol P, Quance C, Gertonson A, Belfrage J...
Load More...