PPT-Figure e-2. Semi - quantification of A
SO
rodriguez
Published 2022-06-01 | 4904 Views
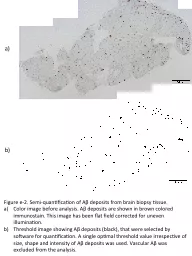
β deposits from brain biopsy tissue Color image before analysis A β deposits are shown in brown colored immunostain This image has been flat field corrected for
Download Presentation
Download Presentation The PPT/PDF document "Figure e-2. Semi - quantification of A" is the property of its rightful owner. Permission is granted to download and print the materials on this website for personal, non-commercial use only, and to display it on your personal computer provided you do not modify the materials and that you retain all copyright notices contained in the materials. By downloading content from our website, you accept the terms of this agreement.