PPT-Graph and label the axes to show how much of each good
Author : phoebe-click | Published Date : 2019-02-28
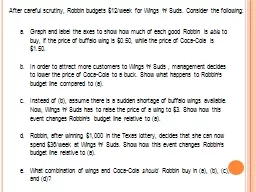
Robbin is able to buy if the price of buffalo wing is 050 while the price of CocaCola is 150 In order to attract more customers to Wings n Suds management decides
Presentation Embed Code
Download Presentation
Download Presentation The PPT/PDF document "Graph and label the axes to show how muc..." is the property of its rightful owner. Permission is granted to download and print the materials on this website for personal, non-commercial use only, and to display it on your personal computer provided you do not modify the materials and that you retain all copyright notices contained in the materials. By downloading content from our website, you accept the terms of this agreement.
Graph and label the axes to show how much of each good: Transcript
Download Rules Of Document
"Graph and label the axes to show how much of each good"The content belongs to its owner. You may download and print it for personal use, without modification, and keep all copyright notices. By downloading, you agree to these terms.
Related Documents