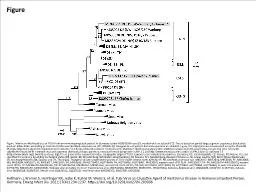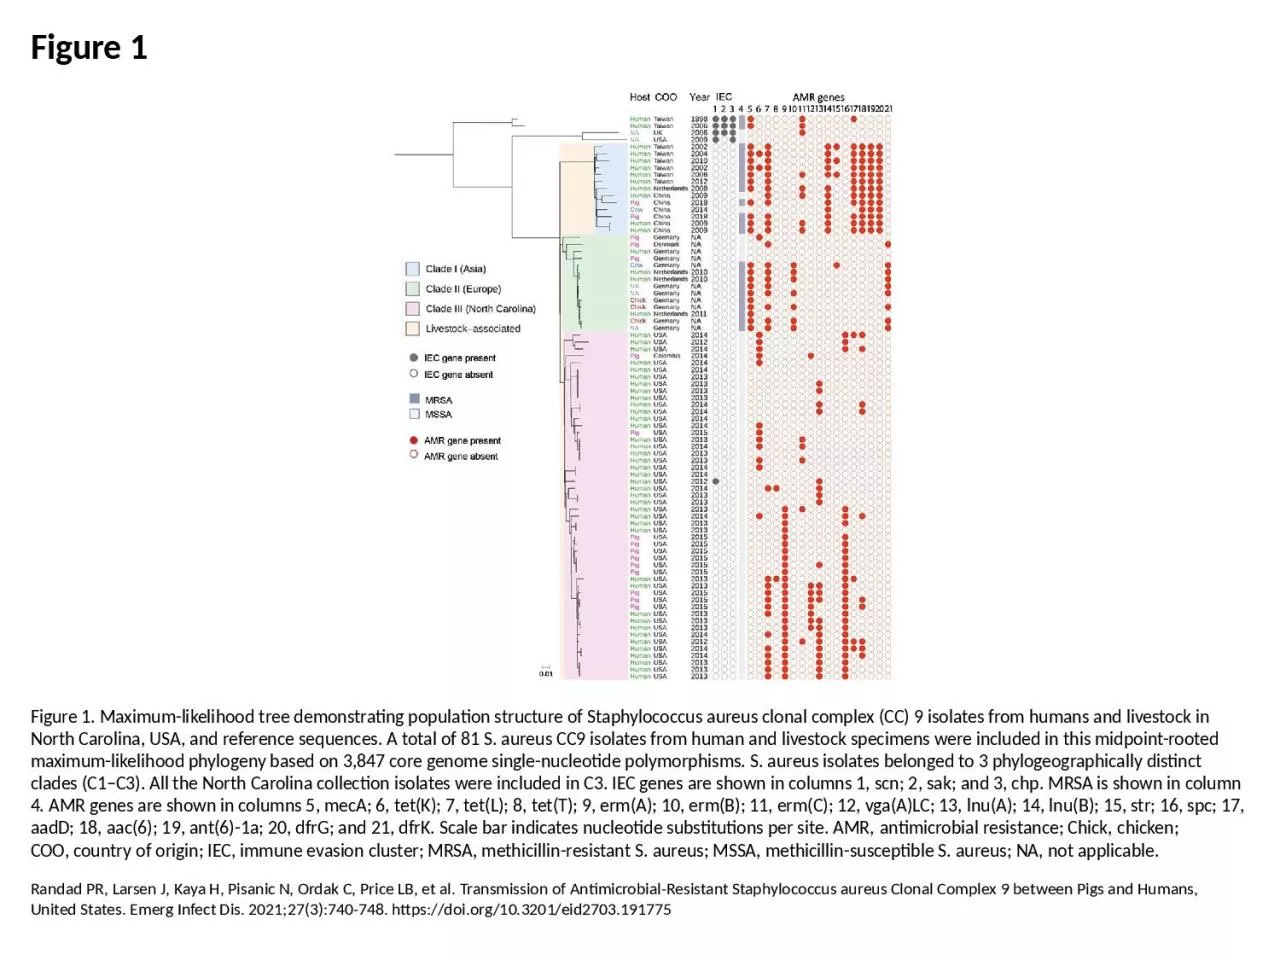
PPT-Figure 1 Figure 1. Maximum-likelihood tree demonstrating population structure of Staphylococcus
Author : patricia | Published Date : 2024-01-29
Randad PR Larsen J Kaya H Pisanic N Ordak C Price LB et al Transmission of AntimicrobialResistant Staphylococcus aureus Clonal Complex 9 between Pigs and Humans
Presentation Embed Code
Download Presentation
Download Presentation The PPT/PDF document "Figure 1 Figure 1. Maximum-likelihood tr..." is the property of its rightful owner. Permission is granted to download and print the materials on this website for personal, non-commercial use only, and to display it on your personal computer provided you do not modify the materials and that you retain all copyright notices contained in the materials. By downloading content from our website, you accept the terms of this agreement.
Figure 1 Figure 1. Maximum-likelihood tree demonstrating population structure of Staphylococcus: Transcript
Download Document
Here is the link to download the presentation.
"Figure 1 Figure 1. Maximum-likelihood tree demonstrating population structure of Staphylococcus"The content belongs to its owner. You may download and print it for personal use, without modification, and keep all copyright notices. By downloading, you agree to these terms.
Related Documents