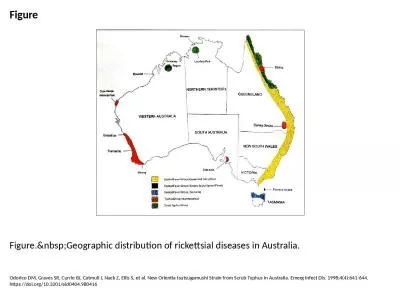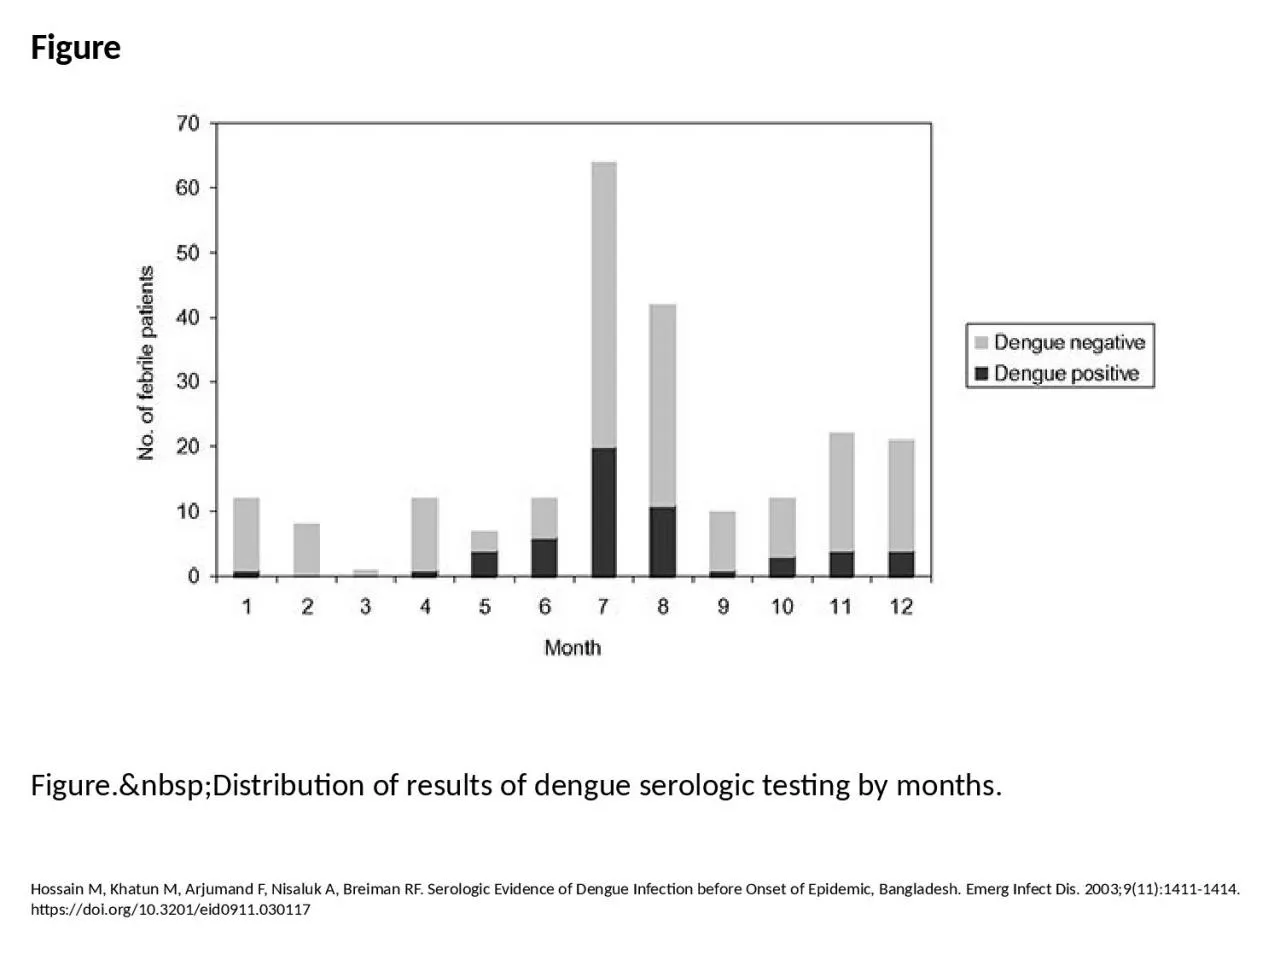
PPT-Figure Figure. Distribution of results of dengue serologic testing by months.
Author : pamela | Published Date : 2023-07-22
Hossain M Khatun M Arjumand F Nisaluk A Breiman RF Serologic Evidence of Dengue Infection before Onset of Epidemic Bangladesh Emerg Infect Dis 200391114111414 httpsdoiorg103201eid0911030117
Presentation Embed Code
Download Presentation
Download Presentation The PPT/PDF document "Figure Figure. Distribution of ..." is the property of its rightful owner. Permission is granted to download and print the materials on this website for personal, non-commercial use only, and to display it on your personal computer provided you do not modify the materials and that you retain all copyright notices contained in the materials. By downloading content from our website, you accept the terms of this agreement.
Figure Figure. Distribution of results of dengue serologic testing by months.: Transcript
Download Document
Here is the link to download the presentation.
"Figure Figure. Distribution of results of dengue serologic testing by months."The content belongs to its owner. You may download and print it for personal use, without modification, and keep all copyright notices. By downloading, you agree to these terms.
Related Documents