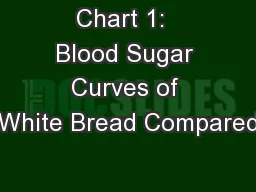
PPT-Chart 1: Blood Sugar Curves of White Bread Compared
Author : natalia-silvester | Published Date : 2016-08-12
Bread with Added Fiber Sourdough and Vinegar Chart 2 Glycemic Index of Various Breads and Grain Products Bread 1 Slice Sugar 10 grams Other 50 grams Source Created
Presentation Embed Code
Download Presentation
Download Presentation The PPT/PDF document "Chart 1: Blood Sugar Curves of White Br..." is the property of its rightful owner. Permission is granted to download and print the materials on this website for personal, non-commercial use only, and to display it on your personal computer provided you do not modify the materials and that you retain all copyright notices contained in the materials. By downloading content from our website, you accept the terms of this agreement.
Chart 1: Blood Sugar Curves of White Bread Compared: Transcript
Download Document
Here is the link to download the presentation.
"Chart 1: Blood Sugar Curves of White Bread Compared"The content belongs to its owner. You may download and print it for personal use, without modification, and keep all copyright notices. By downloading, you agree to these terms.
Related Documents