PDF-How are the two graphs different?
Name
Date
a
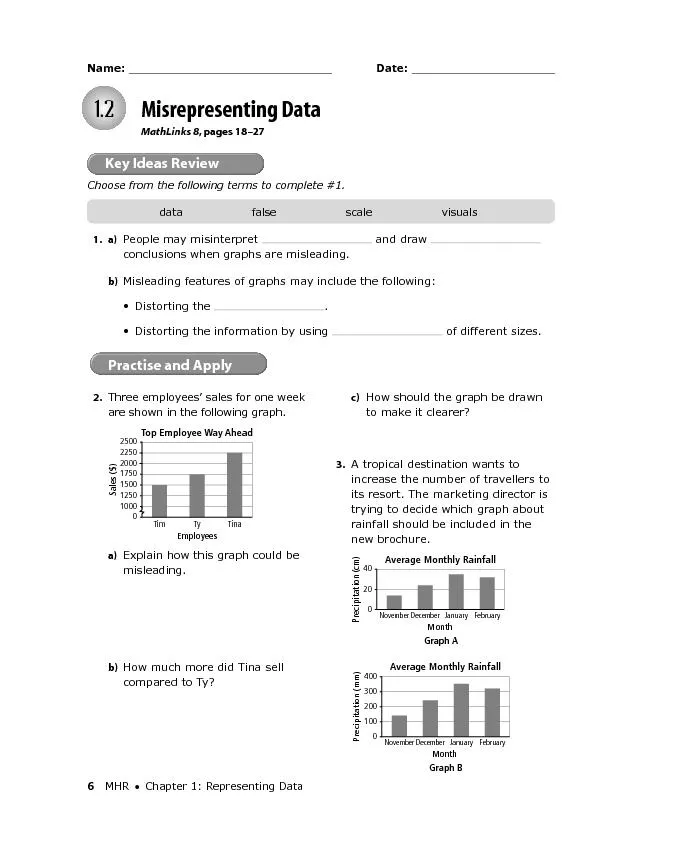
b Explain how Graph A could be misleading
c Which graph do you think the director should choose Explain your answer
4 The fans at a football game were
Download Presentation
"How are the two graphs different?" is the property of its rightful owner. Permission is granted to download and print materials on this website for personal, non-commercial use only, provided you retain all copyright notices. By downloading content from our website, you accept the terms of this agreement.
Presentation Transcript
Transcript not available.