PDF-HDUVRQVFRUUHODWLRQ Introduction Often several quantitative variables are measured on each member of a sample
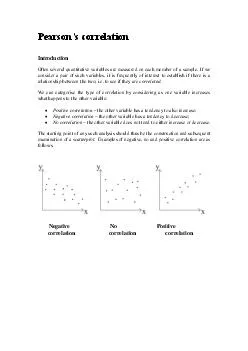
If we consider a pair of such variables it is frequently of interest to establish if there is a relationship between the two ie to see if they are correlated We
Download Presentation
"HDUVRQVFRUUHODWLRQ Introduction Often several quantitative v " is the property of its rightful owner. Permission is granted to download and print materials on this website for personal, non-commercial use only, provided you retain all copyright notices. By downloading content from our website, you accept the terms of this agreement.
Presentation Transcript
Transcript not available.