PDF-flow charts of driver system (left) and decision system (right)
Author : marina-yarberry | Published Date : 2015-10-22
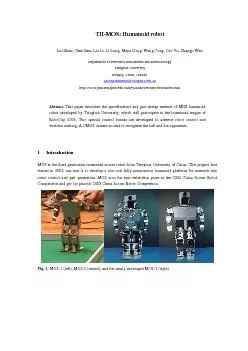
Fig 2The two control boards and their flow charts The whole flow MOS has a CMOS camera for recognizing the target object decision system selects a robot motion from
Presentation Embed Code
Download Presentation
Download Presentation The PPT/PDF document "flow charts of driver system (left) and ..." is the property of its rightful owner. Permission is granted to download and print the materials on this website for personal, non-commercial use only, and to display it on your personal computer provided you do not modify the materials and that you retain all copyright notices contained in the materials. By downloading content from our website, you accept the terms of this agreement.
flow charts of driver system (left) and decision system (right): Transcript
Download Rules Of Document
"flow charts of driver system (left) and decision system (right)"The content belongs to its owner. You may download and print it for personal use, without modification, and keep all copyright notices. By downloading, you agree to these terms.
Related Documents