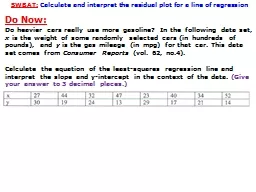
PPT-SWBAT: Calculate and interpret the residual plot for a line of regression
Author : lois-ondreau | Published Date : 2018-10-25
Do Now Do heavier cars really use more gasoline In the following data set x is the weight of some randomly selected cars in hundreds of pounds and y is the gas
Presentation Embed Code
Download Presentation
Download Presentation The PPT/PDF document "SWBAT: Calculate and interpret the res..." is the property of its rightful owner. Permission is granted to download and print the materials on this website for personal, non-commercial use only, and to display it on your personal computer provided you do not modify the materials and that you retain all copyright notices contained in the materials. By downloading content from our website, you accept the terms of this agreement.
SWBAT: Calculate and interpret the residual plot for a line of regression: Transcript
Download Rules Of Document
"SWBAT: Calculate and interpret the residual plot for a line of regression"The content belongs to its owner. You may download and print it for personal use, without modification, and keep all copyright notices. By downloading, you agree to these terms.
Related Documents