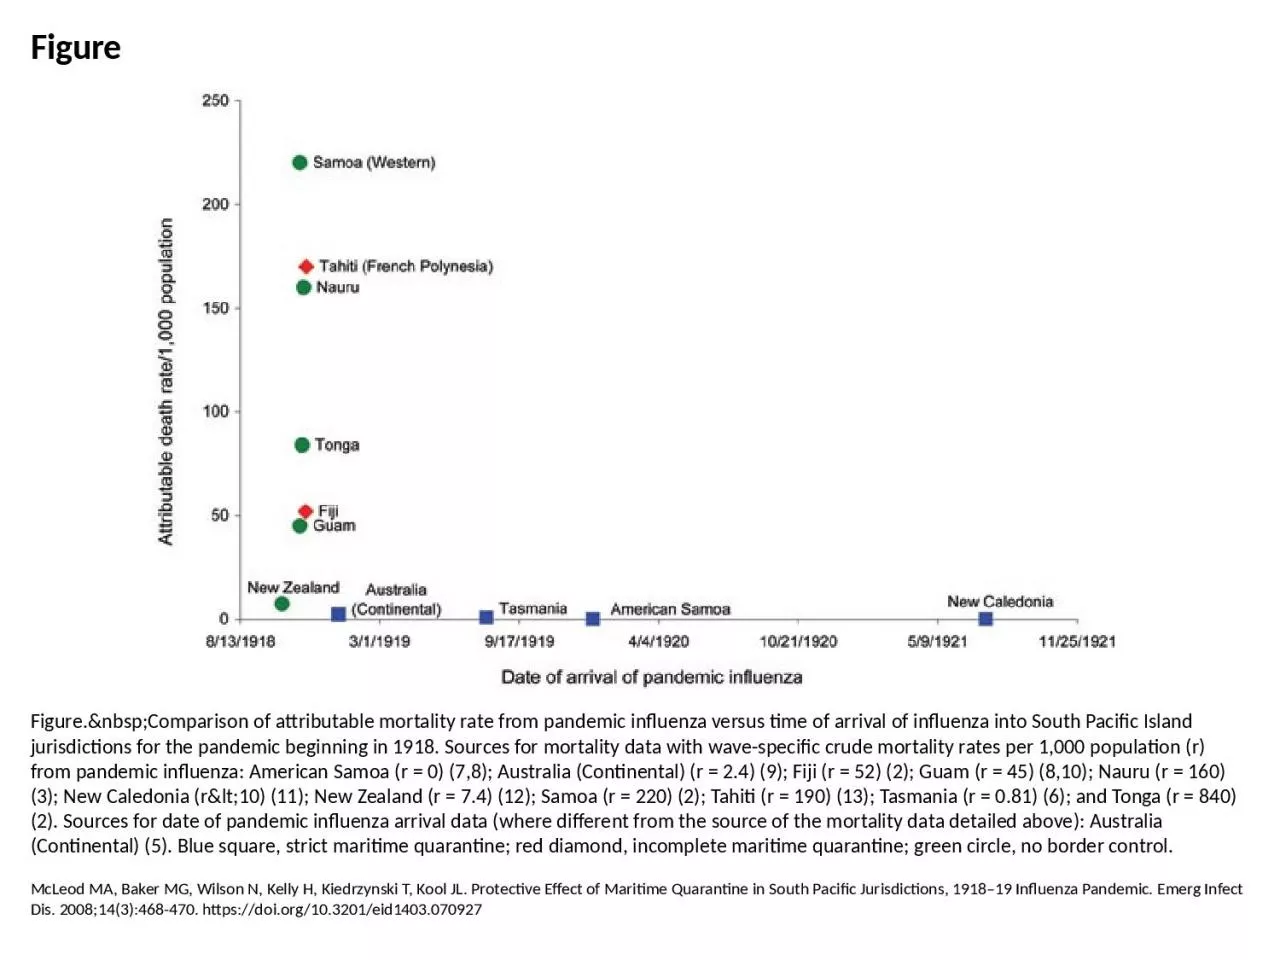
PPT-Figure Figure. Comparison of attributable mortality rate from pandemic influenza
Author : lily | Published Date : 2023-09-18
McLeod MA Baker MG Wilson N Kelly H Kiedrzynski T Kool JL Protective Effect of Maritime Quarantine in South Pacific Jurisdictions 191819 Influenza Pandemic Emerg
Presentation Embed Code
Download Presentation
Download Presentation The PPT/PDF document "Figure Figure. Comparison of at..." is the property of its rightful owner. Permission is granted to download and print the materials on this website for personal, non-commercial use only, and to display it on your personal computer provided you do not modify the materials and that you retain all copyright notices contained in the materials. By downloading content from our website, you accept the terms of this agreement.
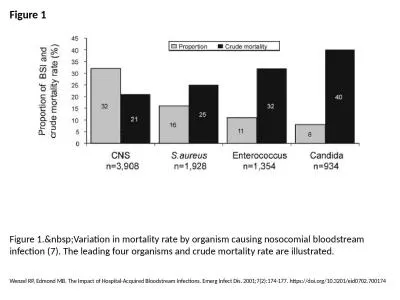
Figure Figure. Comparison of attributable mortality rate from pandemic influenza: Transcript
Download Document
Here is the link to download the presentation.
"Figure Figure. Comparison of attributable mortality rate from pandemic influenza"The content belongs to its owner. You may download and print it for personal use, without modification, and keep all copyright notices. By downloading, you agree to these terms.
Related Documents