PDF-Assessing Normality
Author : liane-varnes | Published Date : 2017-02-26
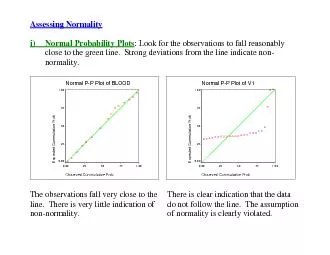
Normal Probability Plots Look for the observations to fall reasonably close to the green line Strong deviations from the line indicate nonnormality Expected Cummulative
Presentation Embed Code
Download Presentation
Download Presentation The PPT/PDF document "Assessing Normality" is the property of its rightful owner. Permission is granted to download and print the materials on this website for personal, non-commercial use only, and to display it on your personal computer provided you do not modify the materials and that you retain all copyright notices contained in the materials. By downloading content from our website, you accept the terms of this agreement.
Assessing Normality: Transcript
Download Rules Of Document
"Assessing Normality"The content belongs to its owner. You may download and print it for personal use, without modification, and keep all copyright notices. By downloading, you agree to these terms.
Related Documents