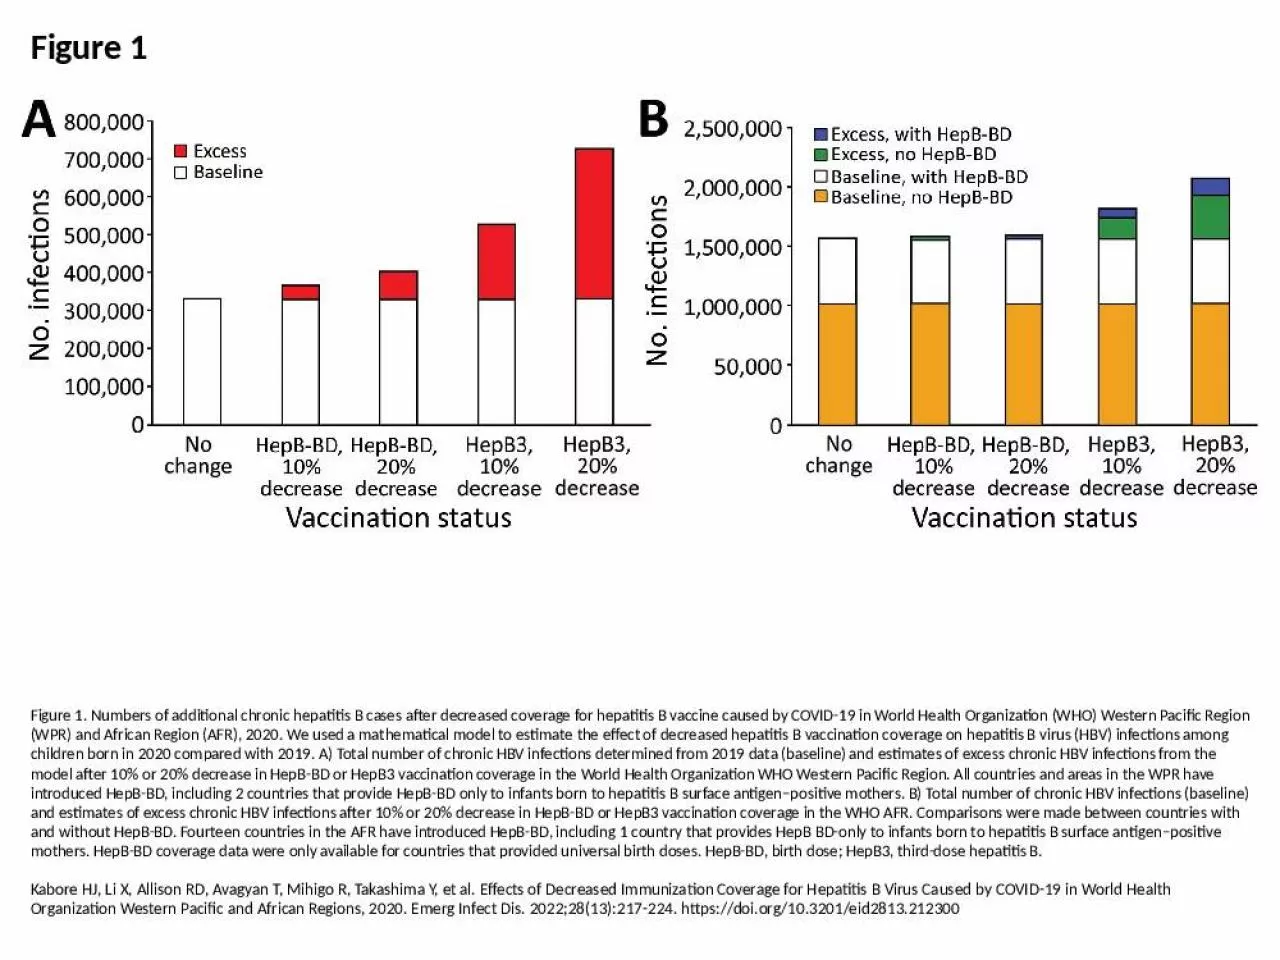
PPT-Figure 1 Figure 1. Numbers of additional chronic hepatitis B cases after decreased coverage
Author : leonard | Published Date : 2024-09-18
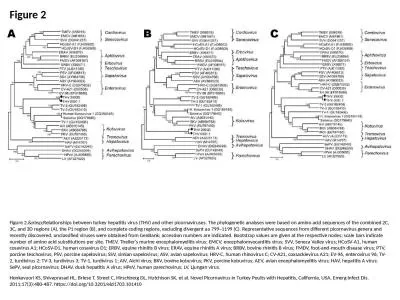
Kabore HJ Li X Allison RD Avagyan T Mihigo R Takashima Y et al Effects of Decreased Immunization Coverage for Hepatitis B Virus Caused by COVID19 in World Health
Presentation Embed Code
Download Presentation
Download Presentation The PPT/PDF document "Figure 1 Figure 1. Numbers of additional..." is the property of its rightful owner. Permission is granted to download and print the materials on this website for personal, non-commercial use only, and to display it on your personal computer provided you do not modify the materials and that you retain all copyright notices contained in the materials. By downloading content from our website, you accept the terms of this agreement.
Figure 1 Figure 1. Numbers of additional chronic hepatitis B cases after decreased coverage: Transcript
Download Document
Here is the link to download the presentation.
"Figure 1 Figure 1. Numbers of additional chronic hepatitis B cases after decreased coverage"The content belongs to its owner. You may download and print it for personal use, without modification, and keep all copyright notices. By downloading, you agree to these terms.
Related Documents