PPT-One American health statistic that is strikingly above aver
Author : kittie-lecroy | Published Date : 2017-07-03
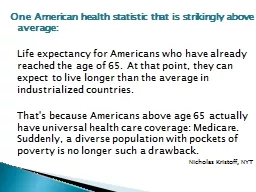
Life expectancy for Americans who have already reached the age of 65 At that point they can expect to live longer than the average in industrialized countries Thats
Presentation Embed Code
Download Presentation
Download Presentation The PPT/PDF document "One American health statistic that is st..." is the property of its rightful owner. Permission is granted to download and print the materials on this website for personal, non-commercial use only, and to display it on your personal computer provided you do not modify the materials and that you retain all copyright notices contained in the materials. By downloading content from our website, you accept the terms of this agreement.
One American health statistic that is strikingly above aver: Transcript
Download Rules Of Document
"One American health statistic that is strikingly above aver"The content belongs to its owner. You may download and print it for personal use, without modification, and keep all copyright notices. By downloading, you agree to these terms.
Related Documents