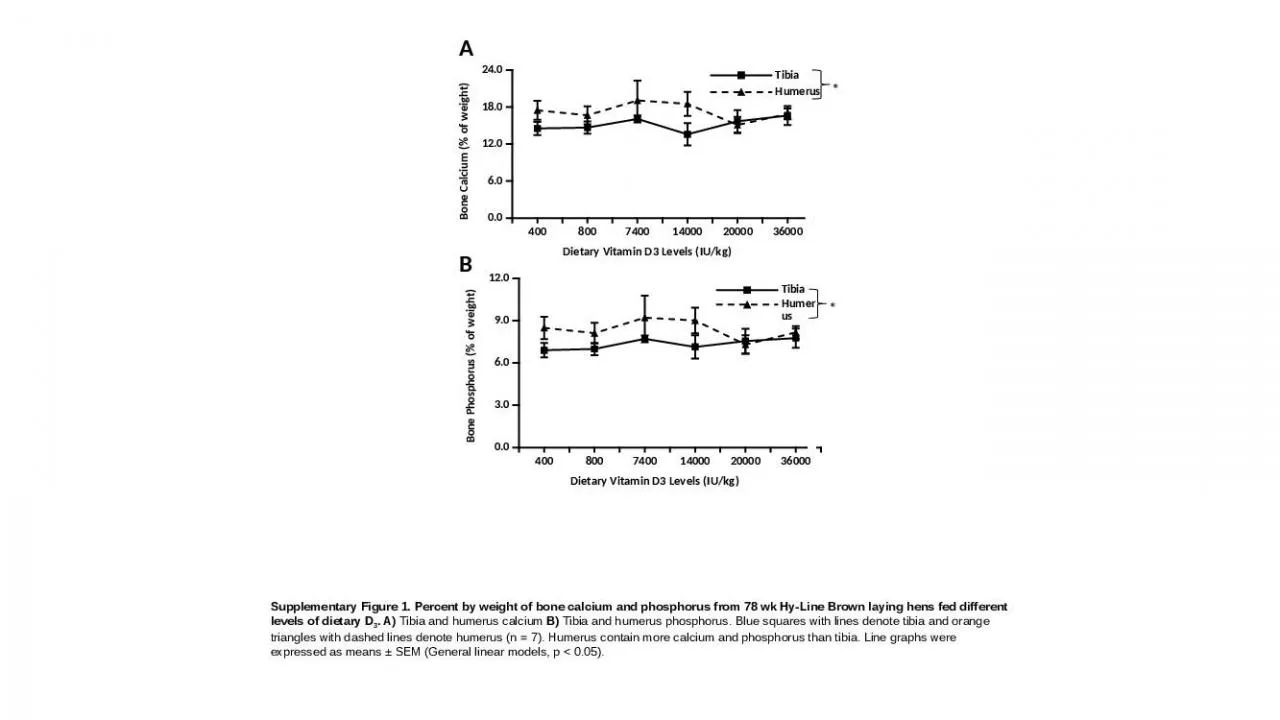
PPT-A B * * Supplementary Figure 1. Percent by weight of bone calcium and phosphorus from
Author : freya | Published Date : 2024-06-08
wk HyLine Brown laying hens fed different levels of dietary D 3 A Tibia and humerus calcium B Tibia and humerus phosphorus Blue squares with lines denote tibia
Presentation Embed Code
Download Presentation
Download Presentation The PPT/PDF document "A B * * Supplementary Figure 1. Percent ..." is the property of its rightful owner. Permission is granted to download and print the materials on this website for personal, non-commercial use only, and to display it on your personal computer provided you do not modify the materials and that you retain all copyright notices contained in the materials. By downloading content from our website, you accept the terms of this agreement.
A B * * Supplementary Figure 1. Percent by weight of bone calcium and phosphorus from: Transcript
Download Document
Here is the link to download the presentation.
"A B * * Supplementary Figure 1. Percent by weight of bone calcium and phosphorus from"The content belongs to its owner. You may download and print it for personal use, without modification, and keep all copyright notices. By downloading, you agree to these terms.
Related Documents