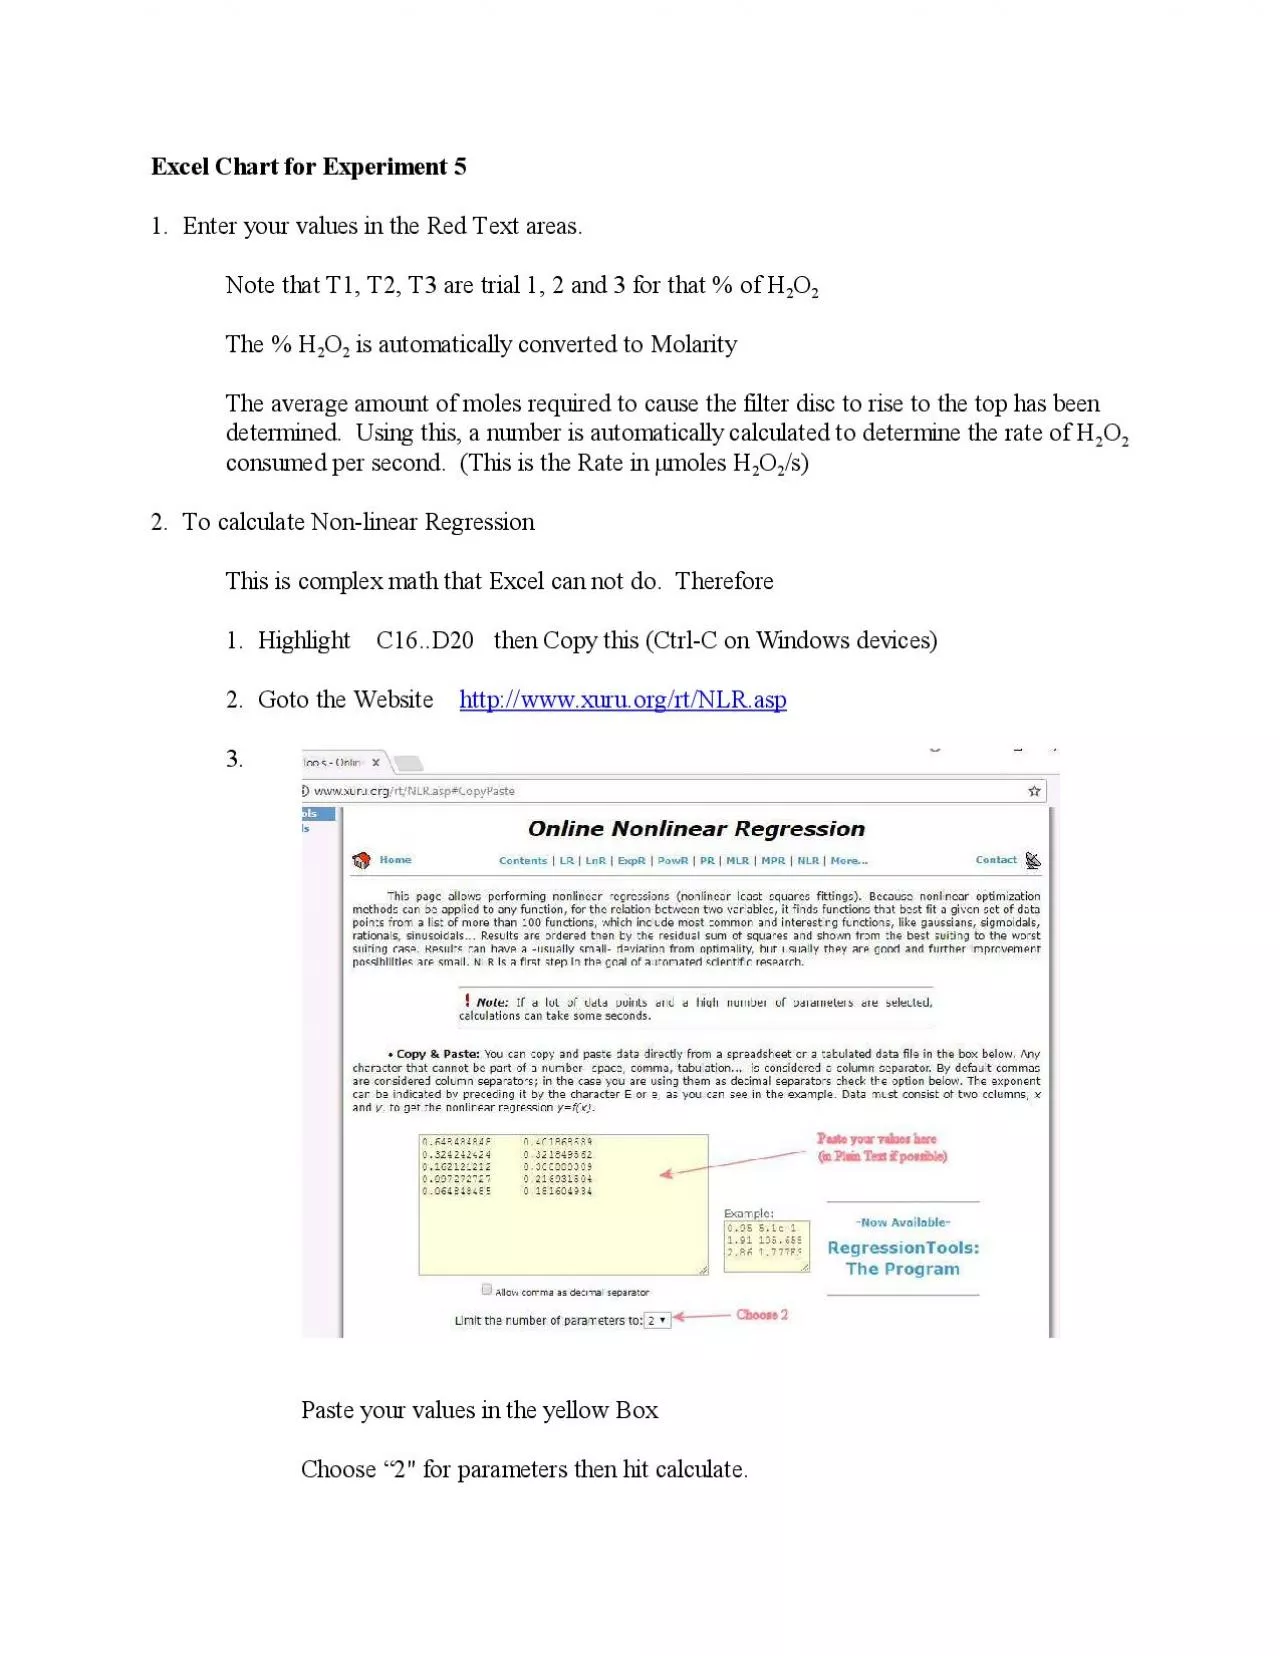
PDF-Excel Chart for Experiment 51 Enter your values in the Red Text areas
Author : fauna | Published Date : 2021-08-15
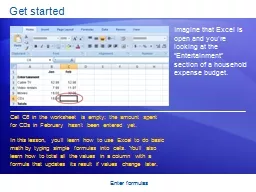
3 Paste your values in the yellow BoxChoose 2 for parameters then hit calculate4 Pick the formula that looks like the MichaelisMenton EquationVVSSKmomaxynumberxxnumber12Highlight
Presentation Embed Code
Download Presentation
Download Presentation The PPT/PDF document "Excel Chart for Experiment 51 Enter you..." is the property of its rightful owner. Permission is granted to download and print the materials on this website for personal, non-commercial use only, and to display it on your personal computer provided you do not modify the materials and that you retain all copyright notices contained in the materials. By downloading content from our website, you accept the terms of this agreement.
Excel Chart for Experiment 51 Enter your values in the Red Text areas: Transcript
Download Document
Here is the link to download the presentation.
"Excel Chart for Experiment 51 Enter your values in the Red Text areas"The content belongs to its owner. You may download and print it for personal use, without modification, and keep all copyright notices. By downloading, you agree to these terms.
Related Documents