PDF-Study the following chart
EX 1
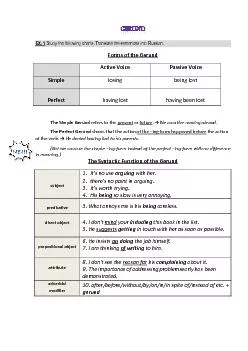
s Translate the sentences into Russian Corms of the Derund
ctive Voice
tassive Voice
Simple
losing
being lost
terfect
having lost
having been lost
The Simple
Download Presentation
"Study the following chart" is the property of its rightful owner. Permission is granted to download and print materials on this website for personal, non-commercial use only, provided you retain all copyright notices. By downloading content from our website, you accept the terms of this agreement.
Presentation Transcript
Transcript not available.