PPT-Figure 2 : Annual contamination rates at UAMS ED from 2014 to 2018
Author : dora | Published Date : 2023-07-08
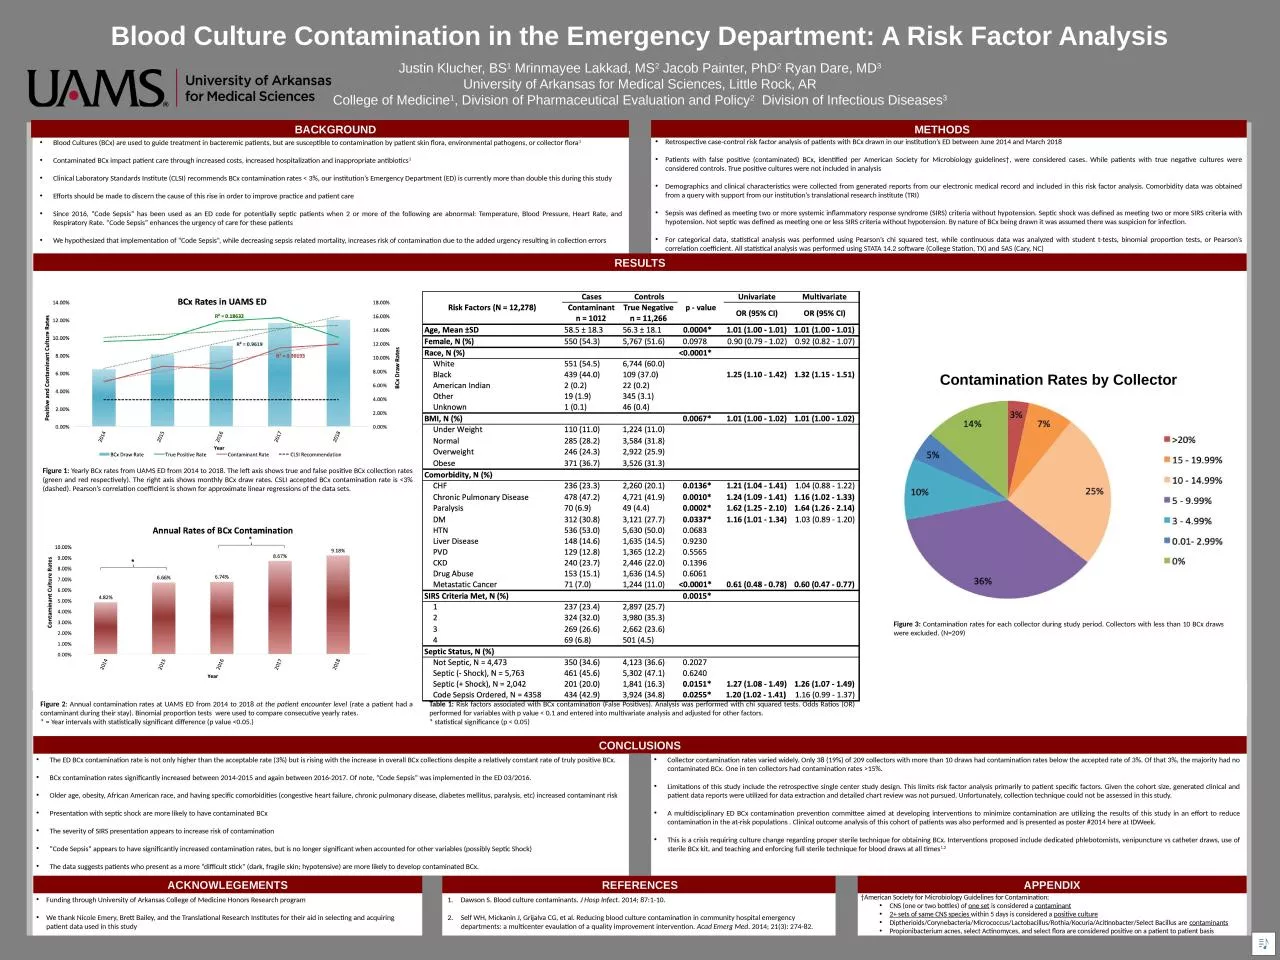
at the patient encounter level rate a patient had a contaminant during their stay Binomial proportion tests were used to compare consecutive yearly rates Year
Presentation Embed Code
Download Presentation
Download Presentation The PPT/PDF document "Figure 2 : Annual contamination rates at..." is the property of its rightful owner. Permission is granted to download and print the materials on this website for personal, non-commercial use only, and to display it on your personal computer provided you do not modify the materials and that you retain all copyright notices contained in the materials. By downloading content from our website, you accept the terms of this agreement.
Figure 2 : Annual contamination rates at UAMS ED from 2014 to 2018: Transcript
Download Document
Here is the link to download the presentation.
"Figure 2 : Annual contamination rates at UAMS ED from 2014 to 2018"The content belongs to its owner. You may download and print it for personal use, without modification, and keep all copyright notices. By downloading, you agree to these terms.
Related Documents