PDF-Resampling Stats in MATLAB exclude syntax excludedata
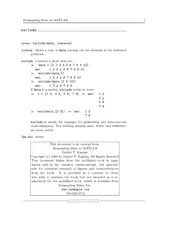
example Consider a short data set data 1 2 3 4 5 6 7 8 9 10 ans 1 2 3 4 5 6 7 8 9 10 excludedata5 ans 1 2 3 4 6 7 8 9 10 excludedata2 5 10 ans 1 3 4 6 7 8 9 If data
Download Presentation
"Resampling Stats in MATLAB exclude syntax excludedata" is the property of its rightful owner. Permission is granted to download and print materials on this website for personal, non-commercial use only, provided you retain all copyright notices. By downloading content from our website, you accept the terms of this agreement.
Presentation Transcript
Transcript not available.