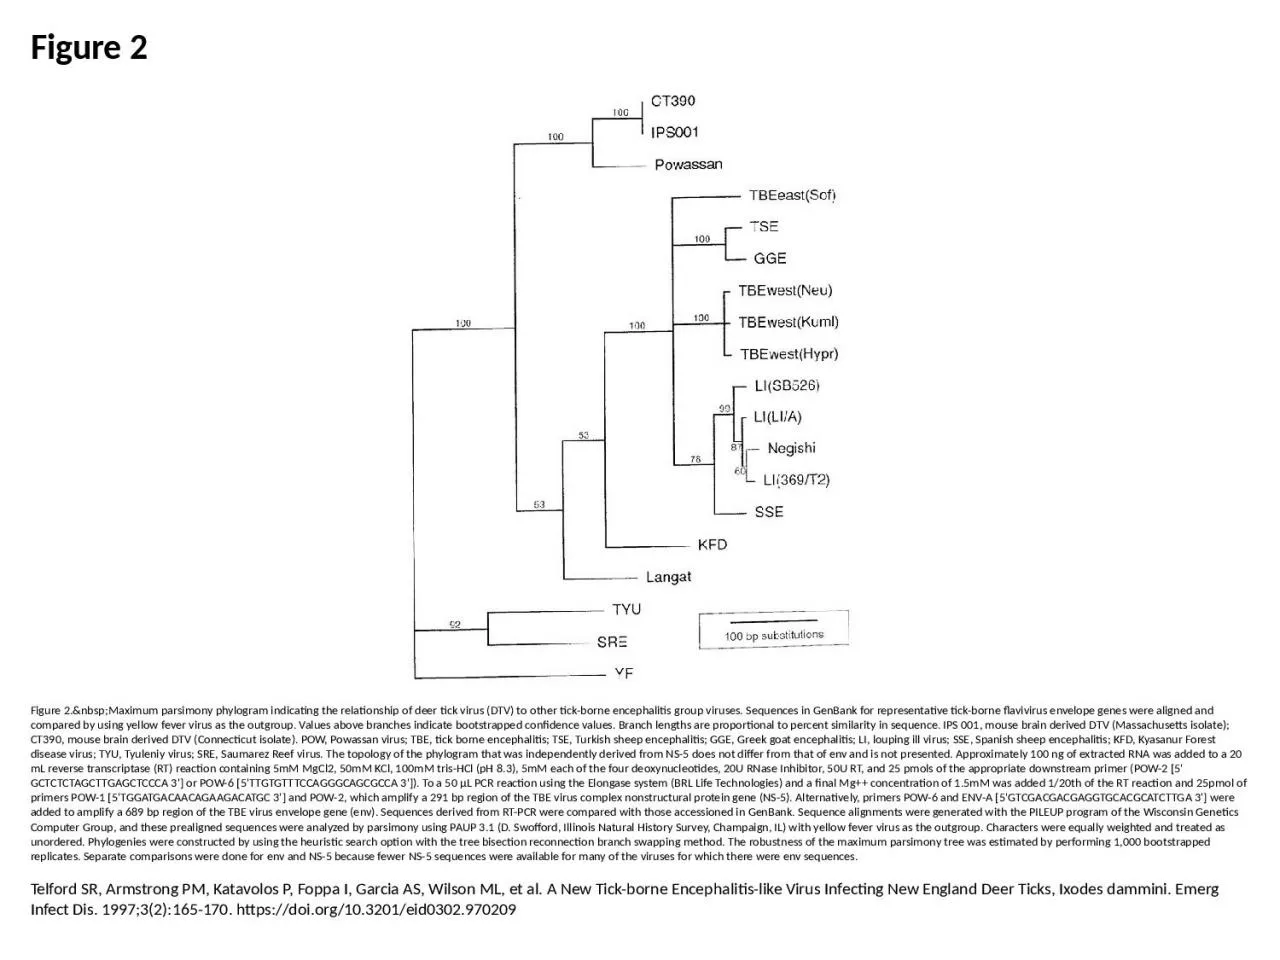
PPT-Figure 2 Figure 2. Maximum parsimony phylogram indicating the relationship of
Author : ash | Published Date : 2023-06-10
Telford SR Armstrong PM Katavolos P Foppa I Garcia AS Wilson ML et al A New Tickborne Encephalitislike Virus Infecting New England Deer Ticks Ixodes dammini Emerg
Presentation Embed Code
Download Presentation
Download Presentation The PPT/PDF document "Figure 2 Figure 2. Maximum pars..." is the property of its rightful owner. Permission is granted to download and print the materials on this website for personal, non-commercial use only, and to display it on your personal computer provided you do not modify the materials and that you retain all copyright notices contained in the materials. By downloading content from our website, you accept the terms of this agreement.
Figure 2 Figure 2. Maximum parsimony phylogram indicating the relationship of: Transcript
Download Document
Here is the link to download the presentation.
"Figure 2 Figure 2. Maximum parsimony phylogram indicating the relationship of"The content belongs to its owner. You may download and print it for personal use, without modification, and keep all copyright notices. By downloading, you agree to these terms.
Related Documents