PPT-Graph the following information
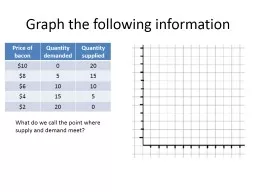
Price of iPhone 6 Quantity demanded Quantity supplied 1000 0 200 800 50 150 600 100 100 400 150 50 200 200 0 What do we call the point where supply and demand meet
Download Presentation
"Graph the following information" is the property of its rightful owner. Permission is granted to download and print materials on this website for personal, non-commercial use only, provided you retain all copyright notices. By downloading content from our website, you accept the terms of this agreement.
Presentation Transcript
Transcript not available.