PPT-Figure 2 Figure 2. SARS-CoV-2 S antibody seroprevalence, titers, and vaccine doses of
Author : abigail | Published Date : 2024-09-06
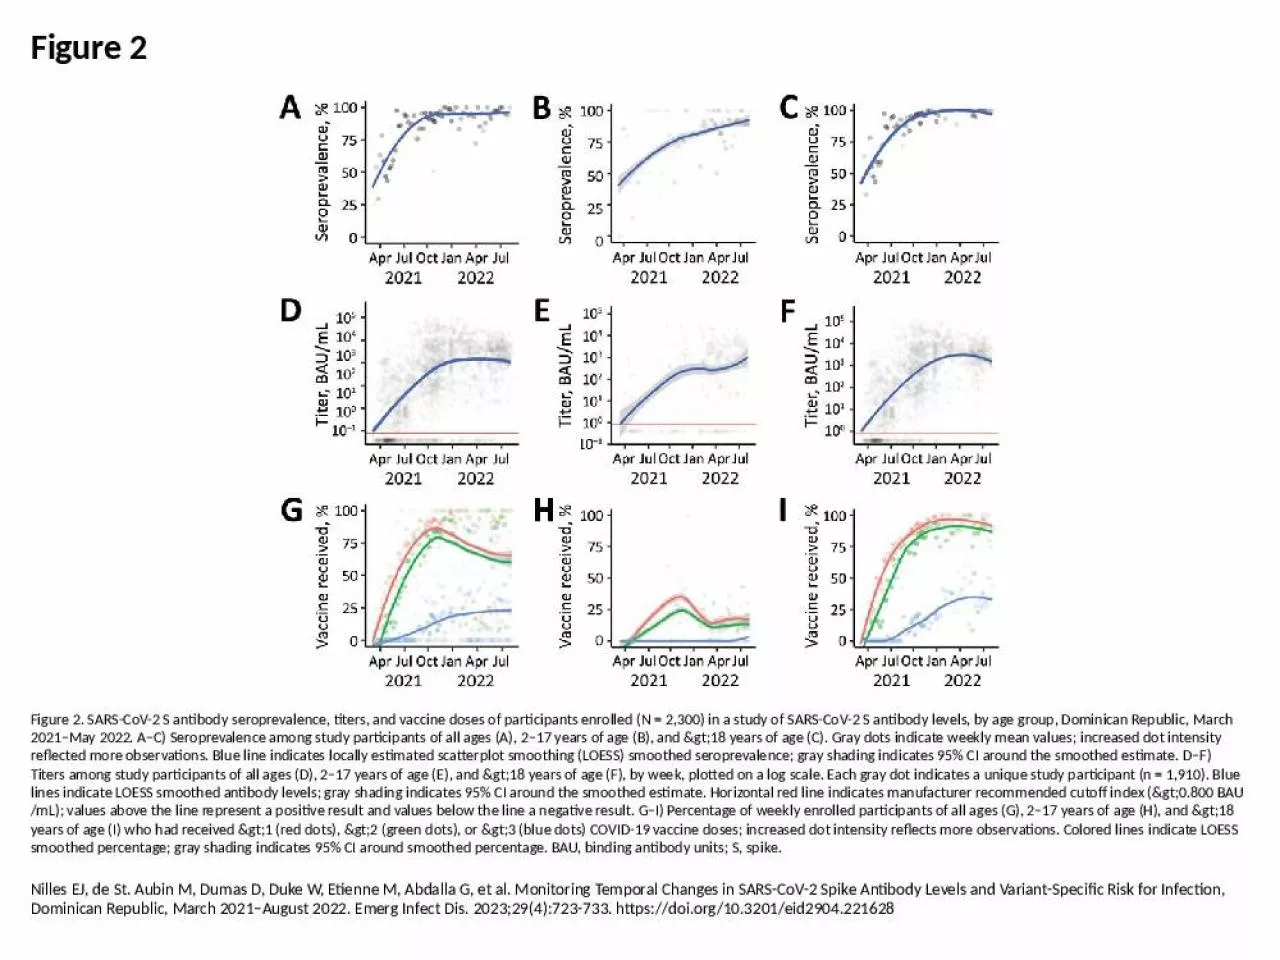
Nilles EJ de St Aubin M Dumas D Duke W Etienne M Abdalla G et al Monitoring Temporal Changes in SARSCoV2 Spike Antibody Levels and VariantSpecific Risk for Infection
Presentation Embed Code
Download Presentation
Download Presentation The PPT/PDF document "Figure 2 Figure 2. SARS-CoV-2 S antibody..." is the property of its rightful owner. Permission is granted to download and print the materials on this website for personal, non-commercial use only, and to display it on your personal computer provided you do not modify the materials and that you retain all copyright notices contained in the materials. By downloading content from our website, you accept the terms of this agreement.
Figure 2 Figure 2. SARS-CoV-2 S antibody seroprevalence, titers, and vaccine doses of: Transcript
Download Document
Here is the link to download the presentation.
"Figure 2 Figure 2. SARS-CoV-2 S antibody seroprevalence, titers, and vaccine doses of"The content belongs to its owner. You may download and print it for personal use, without modification, and keep all copyright notices. By downloading, you agree to these terms.
Related Documents