
Analyze the spread of data 4 3 2 1 0 In addition to level 30 and above and beyond what was taught in class the student may Make connection with other concepts in math Make connection with other content areas ID: 741139
Download Presentation The PPT/PDF document "Calculate Standard Deviation" is the property of its rightful owner. Permission is granted to download and print the materials on this web site for personal, non-commercial use only, and to display it on your personal computer provided you do not modify the materials and that you retain all copyright notices contained in the materials. By downloading content from our website, you accept the terms of this agreement.


Slide1
Calculate Standard Deviation
Analyze the spread of data.Slide2
4
3
210In addition to level 3.0 and above and beyond what was taught in class, the student may:· Make connection with other concepts in math· Make connection with other content areas.The student will summarize, represent, and interpret data on a single count or measurement variable.- Comparing data includes analyzing center of data (mean/median), interquartile range, shape distribution of a graph, standard deviation and the effect of outliers on the data set. - Read, interpret and write summaries of two-way frequency tables which includes calculating joint, marginal and relative frequencies.The student will be able to:- Make dot plots, histograms, box plots and two-way frequency tables.- Calculate standard deviation.- Identify normal distribution of data (bell curve) and convey what it means. With help from theteacher, the student haspartial success with summarizing and interpreting data displayed in a dot plot, histogram, box plot or frequency table.Even with help, the student has no success understanding statistical data.
Focus 6 Learning Goal –
(HS.S-ID.A.1, HS.S-ID.A.2, HS.S-ID.A.3, HS.S-ID.B.5)
=
Students will summarize, represent and interpret data on a single count or measurement variable.Slide3
Standard Deviation
Standard Deviation is a
measure of how spread out numbers are in a data set.It is denoted by σ (sigma).Mean and standard deviation are most frequently used when the distribution of data follows a bell curve (normal distribution).Slide4
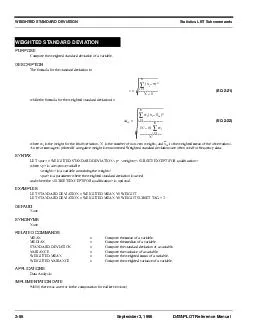
Formula for Standard Deviation
Here is what each part of the formula means:
x is each data item in the data set.
is the mean of the data set.
Basically the numerator states to
subtract the mean from each number in the data set and square it. Then add them all up.
The “
n
” in the denominator is the total number of values you have.
Slide5
Calculate the standard deviation of the data set: 60, 56, 58, 60, 61
Calculate the mean
.(60 + 56 + 58 + 60 + 61) ÷ 5 = 59Compute the variance which is (x – 59)2.(60 – 59)2 = 1(56 – 59)2 = 9(58 – 59)2 = 1(60 – 59)2 = 1(61 – 59)2 = 4Add up the variance.1 + 9 + 1 + 1 + 4 = 16
Divide the variance by (n – 1).
n = 5
5 – 1 = 4
16
÷
4 =
4
Square root that answer.
σ
= 2 This means the standard deviation is 2
.
Slide6
Measures of Deviation Practice
(Each student needs a copy of the activity.)
The data set below gives the prices (in dollars) of phones at an electronic store.35, 50, 60, 60, 75, 65, 80 Calculate the mean ( ):(35 + 50 + 60 + 60 + 75 + 65 + 80) ÷ 760.71 Slide7
Measures of Deviation Practice
Use the table to help calculate the variance
2. (Round all values to the nearest hundredth.) (35 – 60.71) = -25.71661.00(50 – 60.71) = -10.71
114.70
(60 – 60.71) = -0.71
0.50
(60 – 60.71) = -0.71
0.50
(75 – 60.71) = 14.29
204.20
(65 – 60.71) = 4.29
18.40
(80 – 60.71) = 19.29
372.10
1,371.40Slide8
Measures of Deviation Practice
Divide the sum of the squared deviations by (n – 1).
n = 77 – 1 = 61371.4 ÷ 6 = 228.57Square root your answer :15.12The standard deviation (σ) is 15.12. Explain what the mean and standard deviation mean in the context of the problem.A typical phone at the electronics store costs about $60.71. However, 68% of the phones will be $15.12 lower and higher than that price. ($45.59 – $75.83)